
Figure 9.
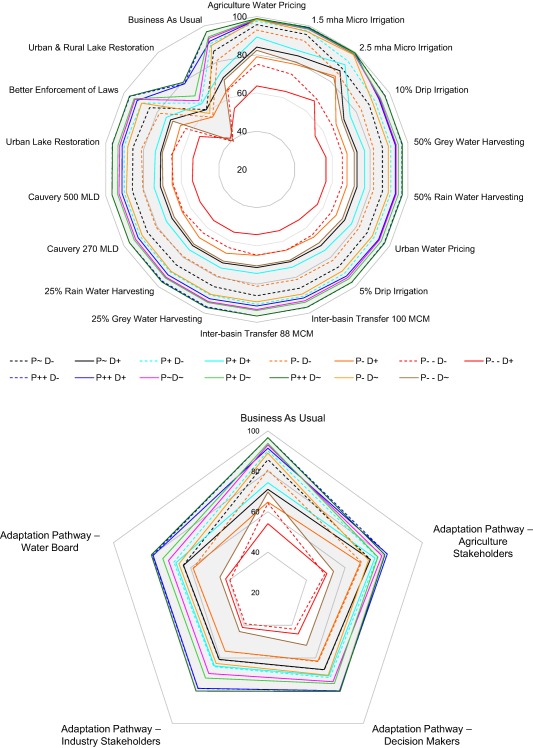
Reliability; percent of the monthly time steps in which the IFR was fully satisfied (upper) for each option separately and (lower) pathway for all 15 climate/demand Narrative Combinations (reliability calculated over the period 1983–2055). In the period 1983–2011 (calibration and validation), IFR reliability based on observed streamflow at Billgundala was 74.1%, while model simulated reliability is 90%. The grey shaded band represents the range of reliability across the Narrative Combinations with baseline demand (D∼).