
Figure 10.
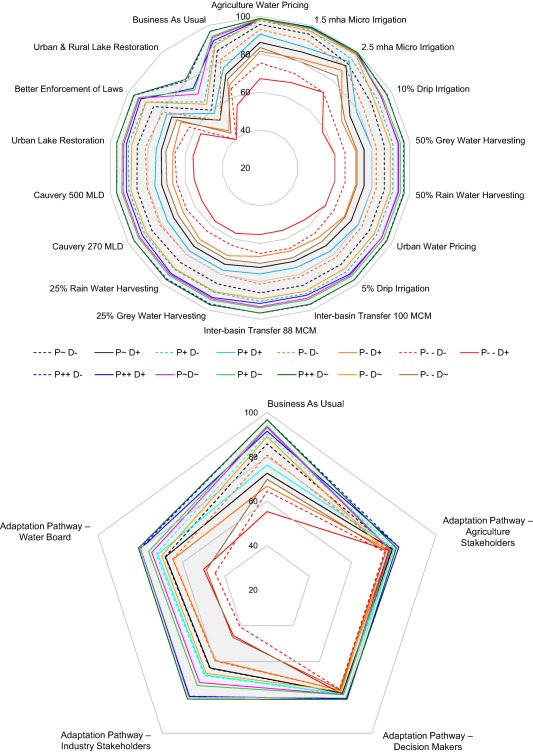
Reliability; the percent of monthly time steps in which water demand of Bangalore was fully satisfied (upper) for each option and (lower) pathway for all 15 Narrative Combinations. The grey shaded band represents the range of reliability across the Narrative Combinations with baseline demand (D∼).