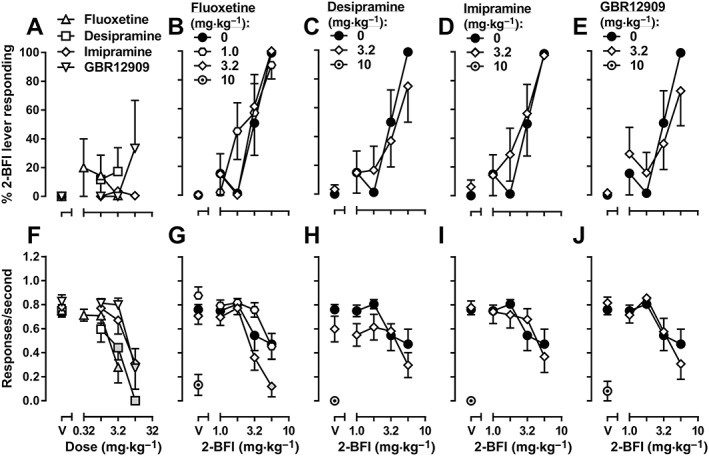
Figure 8.

Discriminative stimulus effects of fluoxetine, desipramine, imipramine or GBR12909 alone (A) or 2‐BFI alone or in combination with fluoxetine (B), desipramine (C), imipramine (D) or GBR12909 (E) in rats discriminating 5.6 mg·kg−1 2‐BFI from its vehicle (n = 7). Upper graphs: substitution profiles of drugs or drug combinations. Data shown are means ± SEM of percentage of 2‐BFI‐appropriate lever responding. Lower graphs: response rate. Data shown are means ± SEM response rate (responses·s−1). Shaded symbols are significantly different (P < 0.05) from vehicle (A) or 2‐BFI alone (B–E).
