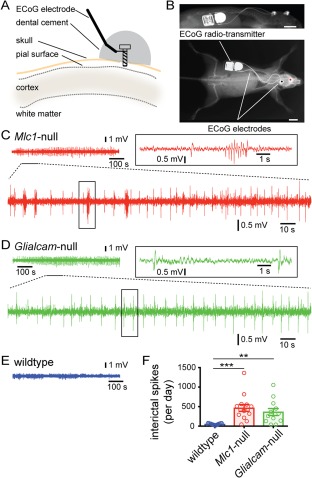
Figure 3.

Spontaneous interictal activity in MLC mice. (A) Schematic representation of the implanted electrode for wireless ECoG recording. (B) X‐ray image of a mouse showing subcutaneous placement of the radiotransmitter (bar = 5mm). (C) Top: representative example 12‐minute ECoG recording from a Mlc1‐null mouse. Bottom: Expanded display of 100 seconds from the top trace. Right, boxed: Further expansion (10 seconds) of the boxed region. (D) Same as (C), but for a Glialcam‐null mouse. (E) Same as (B,C), but for a wild‐type mouse. (F) Bar graph showing the number of interictal spikes per day for all three groups. Open circles indicate individual mice, bars show average ± SEM. Both MLC mouse lines had a significant increase in interictal spikes (wildtype: 51.8 ± 5.3 events/day, n = 15; Mlc1‐null: 465.1 ± 86.8 events/day, n = 14; Glialcam‐null: 361.5 ± 89.0, n = 12; p = 0.0001; wildtype vs Mlc1‐null, p < 0.0001; wildtype vs Glialcam‐null, p = 0.0027). *p < 0.05; **p < 0.01; ***p < 0.001. ECoG = electrocorticogram; MLC = megalencephalic leukoencephalopathy with subcortical cysts.
