Figure 5.

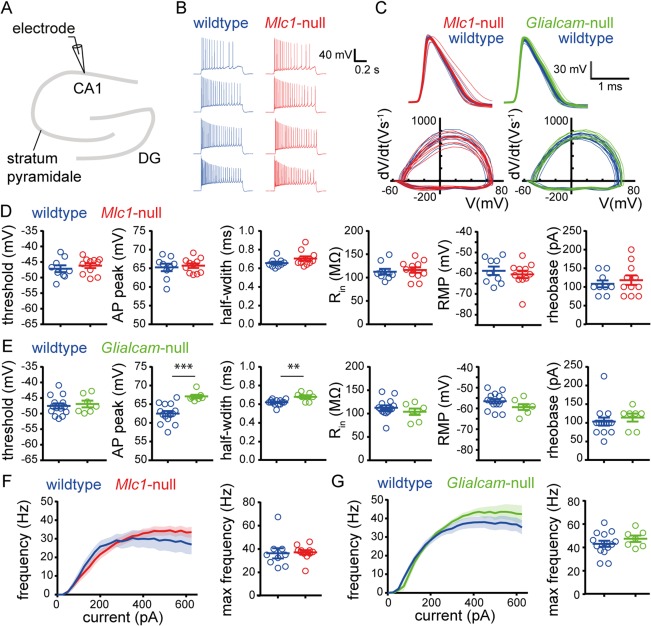
Intrinsic properties of CA1 pyramidal neurons are unaltered in MLC mice. (A) Schematic drawing of the hippocampus showing the patch‐clamp electrode at the region of recording (CA1). (B) Representative AP firing pattern of a wild type (blue) and an Mlc1‐null (red) pyramidal neuron upon 200‐, 300‐, 400‐, and 600‐pA current injection. (C) Top: AP waveform of the first AP fired by single cells (thin lines) and the average AP waveform per genotype (thick lines). Bottom: AP phase plane plot of the first AP fired by single cells. Data of Mlc1‐null (red) and wild‐type littermates (blue) are shown on the left and data of Glialcam‐null (green) and wild‐type littermates (blue) on the right. (D) Active properties (first three panels; threshold, AP peak, and half‐width) and passive properties (last three panels; input resistance [Rin], resting membrane potential [RMP], and rheobase) for wild‐type (blue) and Mlc1‐null mice (red) and (E) for wild‐type (blue) and Glialcam‐null mice (green). AP properties were derived from the first AP fired by a cell. For mean values and statistics, see Supplementary Table 2. (F) Input‐output curve showing AP firing frequency vs stimulation current (left) and scatter plot showing maximum firing frequency (right) for wild‐type (blue) and Mlc1‐null (red) pyramidal neurons and (G) for wild‐type (blue) and Glialcam‐null (green) pyramidal neurons. Input‐output curve was determined using 800‐ms‐long step current injections (25‐pA steps from –100 to 625pA). No significant differences were observed in input‐output curves (wildtype vs Mlc1‐null: p = 0.74; wildtype vs Glialcam‐null: p = 0.39). Error bars and shaded regions indicate SEM. **p < 0.01; ***p < 0.001. AP = action potential; MLC = megalencephalic leukoencephalopathy with subcortical cysts.
