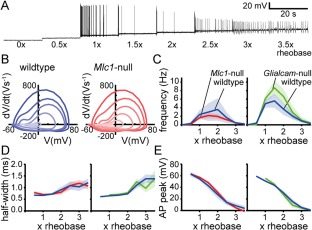
Figure 6.

Prolonged stimulation leads to similar action potential (AP) firing in MLC mice and wild‐type littermates. (A) Representative firing response trace of a CA1 neuron during prolonged stimulation. Prolonged stimulation consisted of eight 20‐second long steps with an increment of one half rheobase (rheobase: current at which an AP was first observed). (B) Representative phase plane plots showing the first derivative (V s–1) versus membrane voltage (mV) for representative wild‐type (blue, left) and Mlc1‐null (red, right) neurons. Each line represents the first AP from a 20‐second current step, with the earliest AP as darkest color and latest AP as lightest color. (C–E) Input‐output curves showing the average firing frequency (C), average half‐width (D), and average AP peak (E) per 20‐second current step vs stimulation current (represented as multiplications of the rheobase). Left panels show data of Mlc1‐null mice (red) and wild‐type littermates (blue) and right panels show data of Glialcam‐null mice (green) and wild‐type littermates (blue). No significant differences between MLC mice and littermate controls were observed for any of these parameters (wildtype vs Mlc1‐null: p = 0.55 [frequency], p = 0.95 [half‐width], and p = 0.71 [absolute peak]; wildtype vs Glialcam‐null: p = 0.26 [frequency], p = 0.30 [half‐width], and p = 0.83 [absolute peak]). Shaded regions indicate SEM. AP = action potential; MLC = megalencephalic leukoencephalopathy with subcortical cysts.
