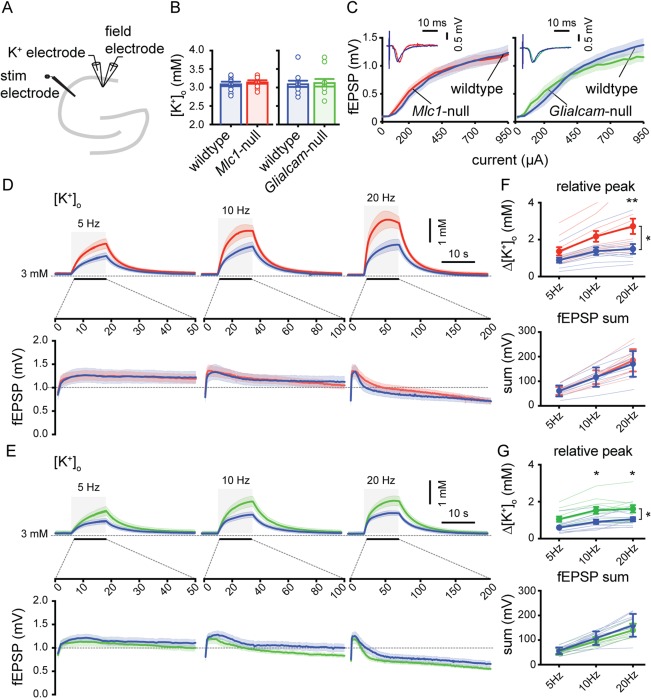
Figure 7.

Larger stimulation‐induced rises in [K+]o in CA1 stratum radiatum of MLC mice. (A) Schematic drawing of the hippocampus showing recording and stimulating electrodes. (B) Basal [K+]o in stratum radiatum (wildtype [blue]: 3.0 ± 0.06mM; n = 10 vs Mlc1‐null [red]: 3.1 ± 0.04; n = 10; p = 0.63; wildtype [blue]: 3.1 ± 0.08; n = 11 vs Glialcam‐null [green]: 3.1 ± 0.10; n = 11; p > 0.99). (C) Input‐output curve showing fEPSP amplitude vs stimulation current. Curves did not differ between MLC mice and littermate controls (wildtype vs Mlc1‐null: p = 0.47; wildtype vs Glialcam‐null: p = 0.14) (D,E) Top: averaged trace of [K+]o upon 10‐second stimulation (gray area) at 5, 10, and 20Hz. Bottom: averaged fEPSP amplitude for each stimulation pulse during 5, 10, and 20Hz stimulation. (F,G) Significant stimulation frequency‐dependent increase in [K+]o in MLC mice (wildtype vs Mlc1‐null: p = 0.034; wildtype vs Glialcam‐null: p = 0.013) with no significant change in fEPSP amplitude sum (wildtype vs Mlc1‐null: p = 0.087; wildtype vs Glialcam‐null: p = 0.29). Thin lines show individual experiment. Error bars and shaded regions indicate SEM. *p < 0.05; **p < 0.01. MLC = megalencephalic leukoencephalopathy with subcortical cysts.
