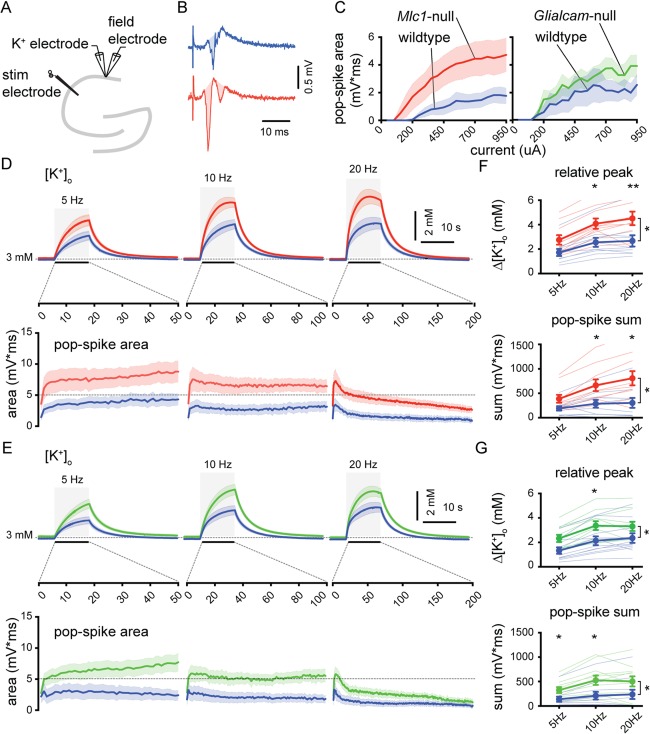
Figure 8.

Increased stimulation‐induced [K+]o rises and network excitability in CA1 stratum pyramidale of MLC mice. (A) Schematic drawing of the hippocampus showing recording and stimulating electrodes. (B) Representative field recording upon single Schaffer collateral stimulation (450 µA) in a wildtype mouse (blue) and an Mlc1‐null mouse (red). The pop‐spike area was defined as the shaded region in the traces. (C) Pop‐spike area versus stimulation current. Although a trend towards larger pop‐spike area was observed this did not reach significance (wildtype [blue; n = 10] vs Mlc1‐null [red; n = 10]: p = 0.053; wildtype [blue; n = 11] vs Glialcam‐null [green; n = 11]: p = 0.076). (D,E) Top: averaged trace of [K+]o upon 10‐second stimulation (gray area) at 5, 10, and 20Hz. Bottom: averaged pop‐spike area for each stimulation pulse during 5, 10, and 20Hz stimulation. (F,G) Significant stimulation frequency dependent increase in [K+]o in MLC mice (wildtype vs Mlc1‐null: p = 0.021; wildtype vs Glialcam‐null: p = 0.035). Total summed pop‐spike area was also significantly increased in MLC mice (wildtype vs Mlc1‐null: p = 0.015; wildtype vs Glialcam‐null: p = 0.033). Thin lines show individual experiment. Error bars and shaded regions indicate SEM. *p < 0.05; **p < 0.01. MLC = megalencephalic leukoencephalopathy with subcortical cysts.
