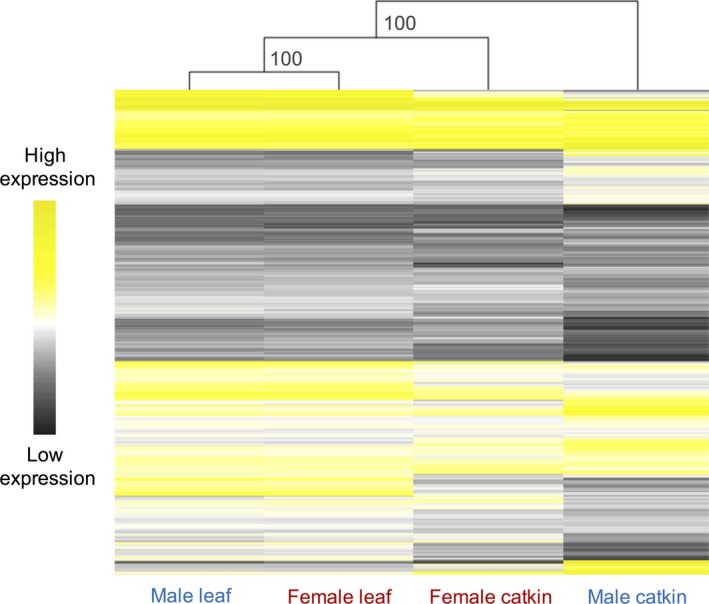
Figure 2.

Heatmap and hierarchical clustering of average male (blue) and average female (red) gene expression in catkin and leaf. The heatmap represents all the filtered genes expressed in both tissues (7,257). Hierarchical gene clustering is based on Euclidean distance with average linkage for log2 RPKM expression for each gene. Numbers at nodes represent the 1,000 replicates percentage bootstrap results
