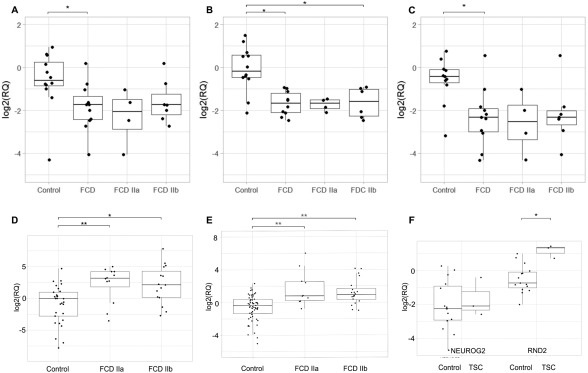
Figure 2.

Expression levels of microRNAs, and NEUROG2 and RND2 genes in human brain tissue with focal cortical dysplasia (FCD) type II and tuberous sclerosis complex (TSC). (A–C) Boxplots depicting log‐transformed relative expression values (RQ) of hsa‐let‐7f (A), hsa‐miR‐31 (B), and hsa‐miR‐34a (C), in formalin‐fixed paraffin‐embedded brain tissue from controls (n = 12) and patients with FCD type II (type IIa, n = 4; type IIb, n = 7), as well as only type IIa and only type IIb. Expression levels were normalized to RNU24 and RNU48. Comparisons with statistically significant differences, determined by the Wilcoxon test corrected by Bonferroni, are marked with asterisks. (D) Boxplot depicting log‐transformed RQ of NEUROG2 gene in fresh‐frozen brain tissue from controls (n = 18), and patients with FCD type IIa (n = 3) and FCD type IIb (n = 4). Expression levels were normalized to glyceraldehyde‐3‐phosphate dehydrogenase (GAPDH). (E) Boxplot depicting log‐transformed RQ of RND2 gene in fresh‐frozen brain tissue from controls (n = 15), and patients with FCD type IIa (n = 3) and FCD type IIb (n = 5). Expression levels were normalized to B‐actin. (F) Boxplot depicting log‐transformed RQ of NEUROG2 and RND2 genes in fresh‐frozen brain tissue from controls (n = 15) and patients with TSC (n = 3). Expression levels were quantified by SYBR Green–based detection and normalized to GAPDH. Comparisons with statistically significant differences, obtained by generalized estimating equation comparison corrected for multiple comparisons, are marked with asterisks. *p < 0.05, **p < 0.001.
