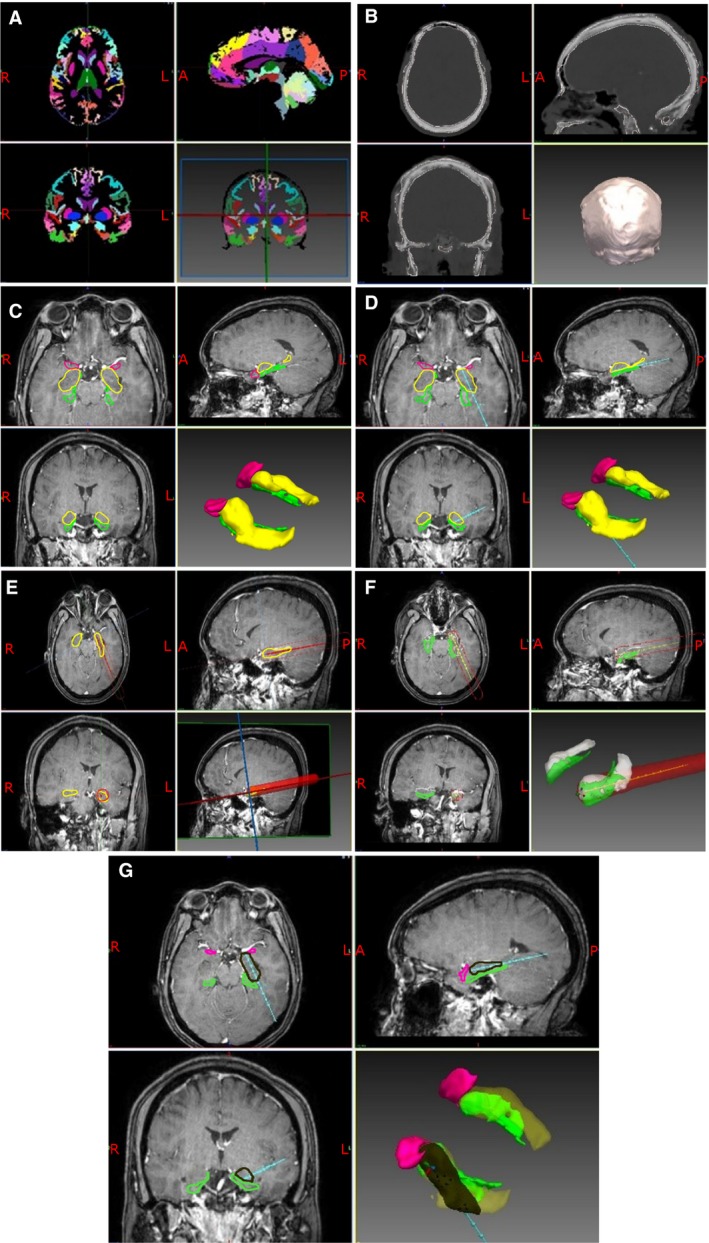
Figure 1.

A, T1‐weighted MRI scans for each patient were used to generate geodesic information flow (GIF) brain parcellations. The whole brain is segmented into 140 separate anatomical structures that can be used to guide trajectory planning and model generation. B, Pseudo‐CT images were generated from the same T1‐weighted MRI scans to provide an image from which a model of the skull can be extracted. The external surface of the skull model is used to calculate the trajectory drilling angle, and the inner surface is used to calculate intracranial trajectory length. C, Models of the cortex, lateral ventricle, amygdala, hippocampus, entorhinal cortex, parahippocampal gyrus, gray matter ribbon, inferior occipital gyrus, middle occipital gyrus, inferior temporal gyrus, middle temporal gyrus, intracranial mask, and sulci are extracted from the GIF parcellation and combined with the skull model. In the image shown, the amygdalohippocampal complex is colored in yellow, entorhinal cortex in pink, and parahippocampal gyrus in green. The remaining models have been excluded for clarity. D, Based on the generated models the optimal trajectory is calculated to target the amygdala while preventing entry to the lateral ventricle, thereby maximizing contact with the hippocampus, distance from sulci and vasculature, and minimizing intracranial trajectory length and drilling angle to the skull. The calculated laser trajectory is shown in blue. E, A region of ablation is then modeled along the model laser trajectory. The Visualase system can ablate a diameter between 5 and 20 mm. A conservative maximum ablation diameter of 15 mm was applied to the model (red cylinder). F, Areas of overlap between the modeled laser ablation zone and the anatomical regions of interest were then extracted so that an estimation of the modeled ablation cavity could be calculated. The volume of each of the regions of interest within the modeled ablation cavity were calculated individually and as a whole. Amygdalohippocampal complex is shown in white and parahippocampal gyrus in green. G, Expected ablation cavity within the ROIs (black) showing the extent of mesial hippocampal head ablation. Amygdalohippocampal complex is shown in yellow, parahippocampal gyrus in green, and entorhinal cortex in pink
