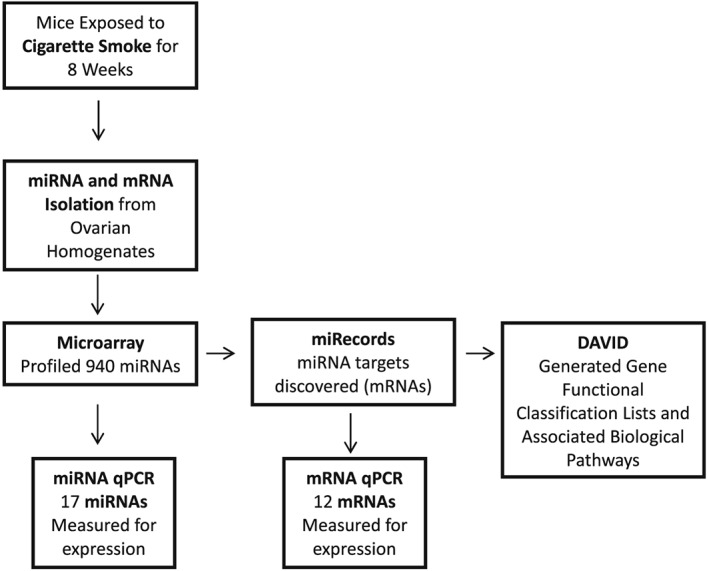
Figure 1.

Overview of experimental methodology. Microarray = miRNA was measured for differences in expression of 940 of the most abundantly expressed miRNAs found in the mouse miRNome between control (n = 6) and cigarette smoke‐exposed (n = 6) ovaries of mice. miRNA qPCR = expression of miRNAs that were either statistically differentially expressed or had a fold change >2 in the miRNA array was examined. miRecords = miRNA target genes of the most dysregulated miRNAs (mostly elevated) were chosen for qPCR validation analysis. mRNA qPCR = miRNA target genes of the most dysregulated miRNAs (mostly elevated) were chosen for qPCR analysis. DAVID = functional classification lists of the mRNAs and their associated biological pathways were generated. qPCR, quantitative polymerase chain reaction
