
Figure 3.
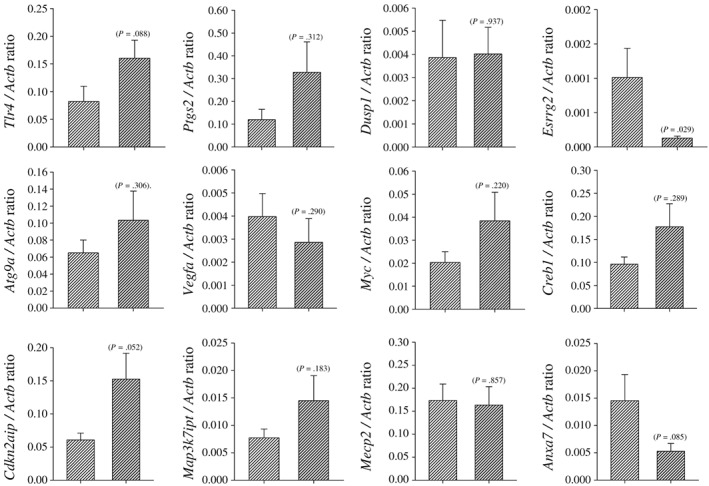
miRNA target gene expression was measured by qPCR. Target mRNA expression levels were quantified and normalized to the internal control gene, Actb. Lighter shaded bar represents the control group and darker shaded bar represents the smoke‐exposed group. Student's t‐test was investigated for statistically significant changes between the treatment groups, and the individual P values are recorded on each figure