. 2018 Jan 25;20(6):4360–4372. doi: 10.1039/c7cp06139k

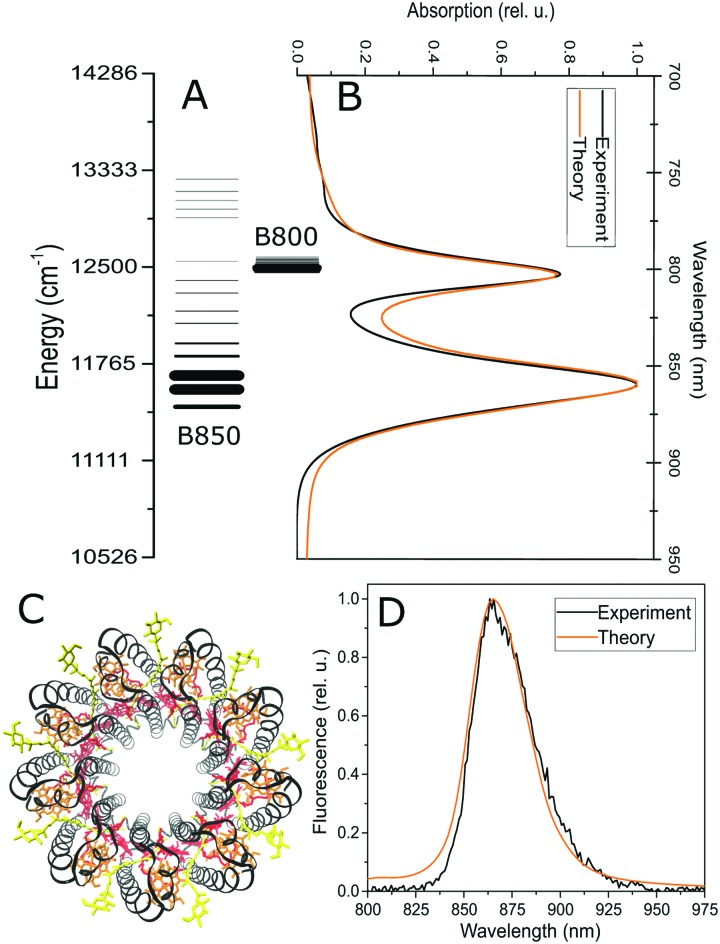
Fig. 1. Structure of the excited state manifold in the LH2 antenna complex. (A) The lines represent individual excitonic states, with energies (position) and oscillator strength (line thickness) averaged over the static pigment energetic disorder. Initial (B) and final (D) light harvesting states in LH2, measured by absorption and fluorescence, respectively. Experimental data (black) are compared to the theoretical model (orange). (C) The structure of the LH2 antenna, with the B850 (red) and B800 (orange) bacteriochlorophyll rings. Black: protein helices, yellow: carotenoids. The picture was rendered in VMD47 based on the ; 2FKW structure used for calculations.8.

Fig. 1