. 2018 Jan 25;20(6):4360–4372. doi: 10.1039/c7cp06139k

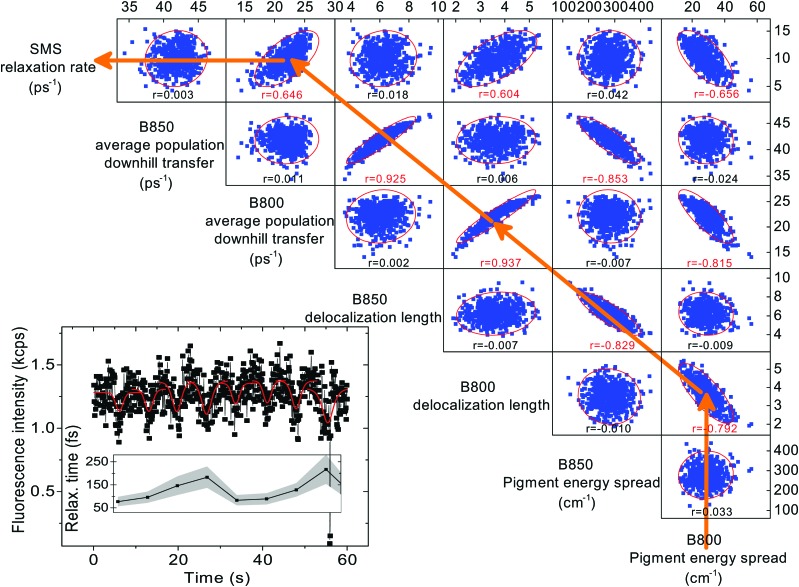
Fig. 5. Correlation matrix of various calculated quantities. Blue points: individual disorder realizations, corresponding to measured relaxation times. Red ellipses: 95% confidence ellipse. Under each correlation plot, the Pearson's correlation coefficient r is given, red values represent p = 0.05 significant correlations. The orange arrows represent the causality of our reasoning: a smaller B800 pigment energy spread leads to larger B800 delocalization, which leads to a faster overall B800 downhill transfer, which corresponds to a faster observed SMS relaxation rate. The definition of the calculated quantities can be found in the Materials and methods section. Inset: An example of a measured ultrafast SMS fluorescence trace of a single LH2 complex, excited at 800 nm, with extracted relaxation times (data from ref. 38, obtained by recording the intensity and varying the delay between the pulses). Red dips: three-state effective description fits by eqn (1); shaded area: standard error of the fits. This trace demonstrates how the individual realizations are sampled on the slow timescale of seconds.

Fig. 5