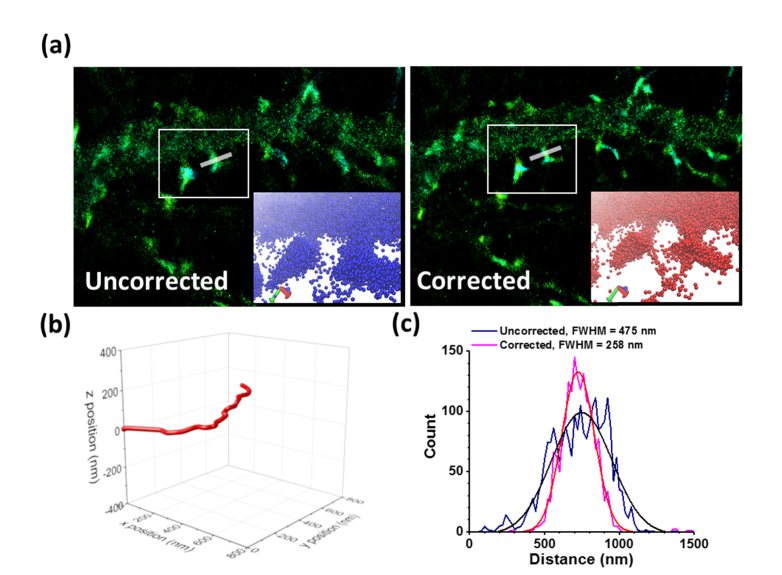
Fig. 7.
Super-resolution images of fixed neurons. Neurons. (a) PALM image of actin-mEos3.2 of fixed neurons before and after correction. The insets show the 3D visualization of the spines inside of the white rectangles (see Visualization 1 (12.4MB, avi) ). (b) The position of the fiduciary marker used for the image in 3D. The drift along z axis is relatively smaller (100 nm) than that of lateral dimension (~500 nm, x and y). (c) The linear profile of the selected area shows the width of the spine before and after the drift correction as FWHM of the Gaussian fit.

