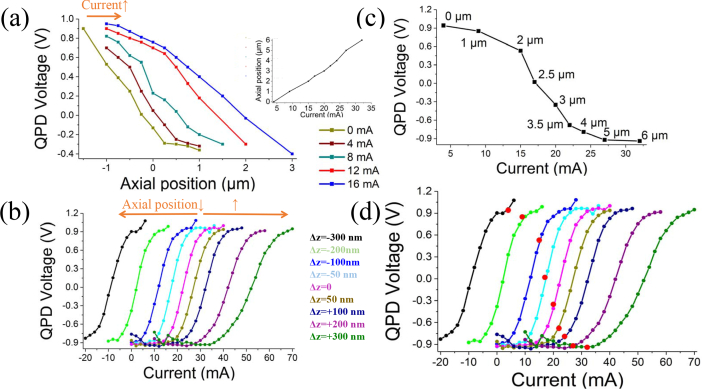
Fig. 2.
Acquisition of calibration curves. a) QPD voltage in dependence of axial position for constant input currents to the lens. Inlay: Axial position vs ETL current. b) QPD voltage vs the ETL input current. The orange arrows indicate how the different QPD(V) vs current curves in the family relate to changes of the physical axial position of the sample relative to the objective. They shift to the right for increasing objective to sample separation, and move to the left upon reduction of this separation. c) QPD vs current at each in-focus position. d) Same as b. The red dots represent the in-focus points of each curve, i.e. the value for which the autofocus corrects.

