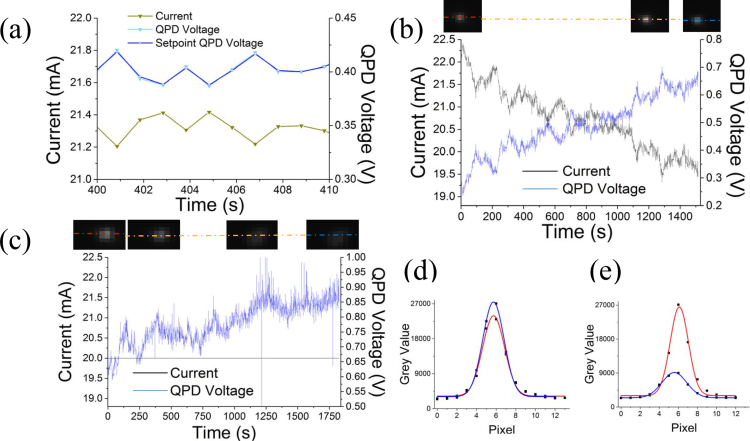
Fig. 4.
Autofocus system. a) Magnified time course showing the QPD voltage following the QPD set-point voltage. It also shows the input current trace for the lens. b) Images of a bead which is held in focus over time. The lines indicate where the profiles shown in d were collected. Color code corresponds to colors in d. Below: traces of the QPD voltage and input current for the lens with enabled autofocus. c) Represents the same as in b without autofocusing. The images show a loss of focus over time (top). The current is held constant and the QPD voltage is changing as a result of the focal drift. d) Fitting of the bead profiles in b, taken at the beginning and at the end of imaging series. e) Fitting of the bead profiles in c, taken at the beginning and at the end of imaging series.

