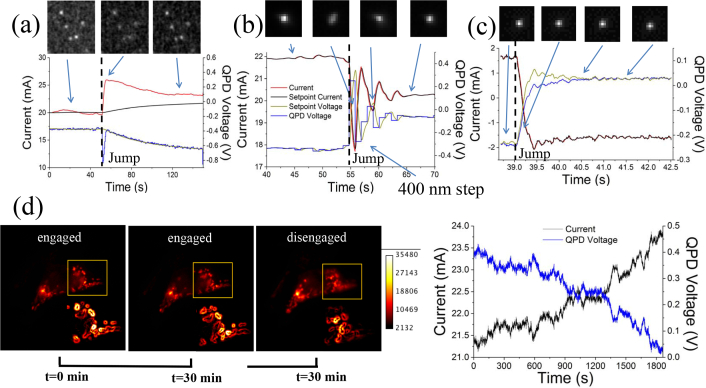
Fig. 5.
Traces and images of enabled autofocus. a) Top images show fluorescent beads before and after the jump. Below: Traces for the QPD voltage and the current for a low proportional PID value and a moving average of the current used to adjust the set-point. Current and QPD voltage recover slowly after manual displacement of objective of about 500 nm. b) Same as in a, with a proportional term and without the moving average. Graphs show a faster focus recovery. c) Same as in a and b, with optimized PID parameters allowing a faster convergence of the QPD to its set-point (proportional constant 0.25, integral constant 0.2 and differential constant 0.01). d) Hek293AD cells displaying labeled mitochondria, imaged over 30 minutes with enabled autofocus (left and middle), and then for another 30 minutes with disabled autofocus (right). Insets show edge detection in a sub-region of the cell, emphasizing the effect of defocus in the right image. On the right: traces of the current and QPD voltage over time as the cell is maintained in focus.

