Figure 1.
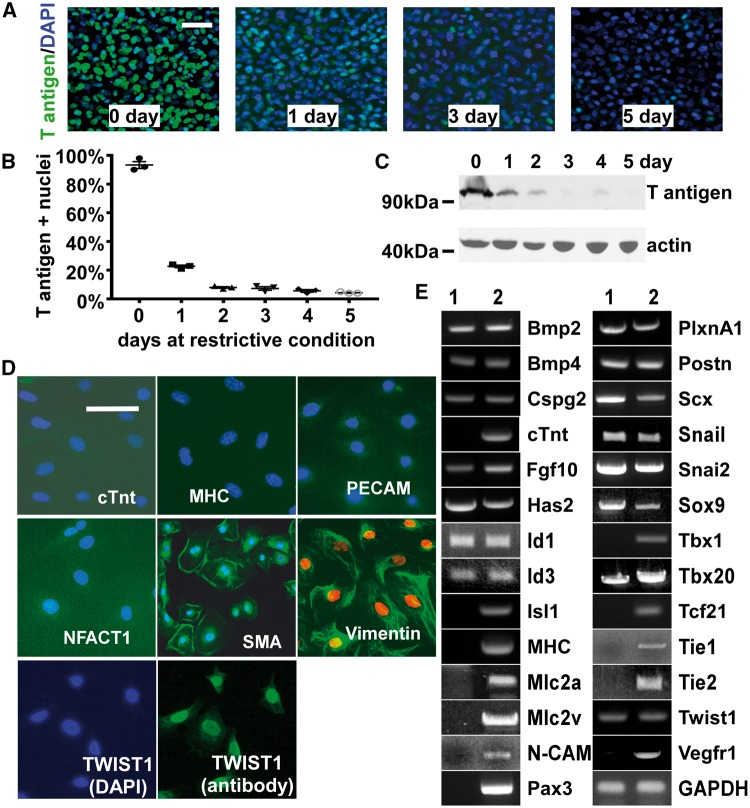
Characterization of tsA58-AVM cells. ( A , B ) tsA58-AVM cells were cultured under the permissive condition and shifted to the restrictive condition for various days as indicated. Cells were stained with an antibody against the large T antigen (green) and DAPI (blue). In panel B , the percentage of large T antigen positive nuclei was quantified. Data were averaged from three independent cultures with error bars indicating standard error (SEM). ( C ) Total protein was isolated from tsA58-AVM cells at various days after being shifted to the restrictive condition followed by western analysis. Actin was used as the loading control. ( D ) tsA58-AVM cells were stained with various antibodies as indicated. ( E ) Total RNA was isolated from tsA58-AVM cells (lane 1) or E11.5 hearts (lane 2, as a positive control for RT-PCR) and was then subjected to RT-PCR analysis. The bars in A and D represent 100 µm.

