Figure 6.
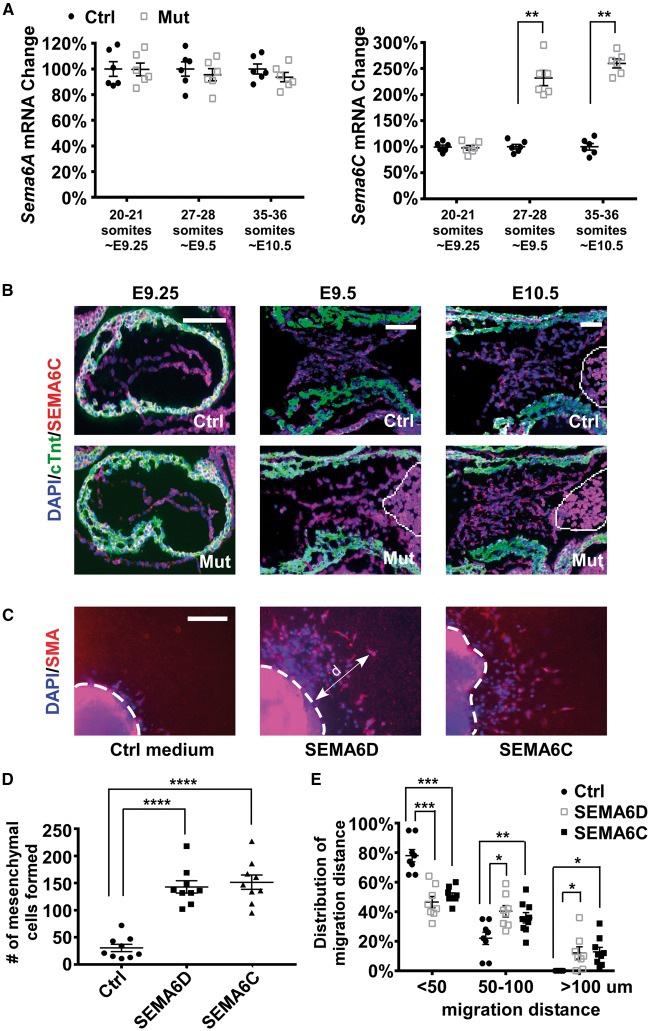
Increased expression of Sema6C may compensate for the loss of Sema6D expression in promoting cushion mesenchymal cell formation. ( A ) AV cushion cells from control (ctrl, Sema6D loxp/loxp ) and mutant (mut, Nfatc1 Cre / Sema6D loxp/loxp ) embryos at different stages were isolated through LCM and subjected to qRT-PCR analysis to examine the expression of Sema6A–C . Expression of Sema6B is undetectable and therefore is not displayed. Data were averaged from six independent embryos of each genotype with error bars representing SEM. Hprt was used as the loading control. ** P < 0.01, Student’s t -test; n.s., no significant difference. ( B ) E9.25–10.5 embryonic sections were stained with antibodies against cTnt (green) and SEMA6C (red). The cells in the circled area are blood cells exhibiting autofluorescence. ( C ) Collagen gel analysis was performed using mutant embryos that were treated with control medium, the SEMA6D conditioned medium (containing the ectodomain of SEMA6D) or the ectodomain of SEMA6C. The explants were stained with an anti-SMA antibody (red) and DAPI (blue). The dotted white lines indicate the origin of the explants. ( D ) The number of mesenchymal cells formed under each condition was counted under a phase-contrast microscope. One-way ANOVA was performed to compare different conditions (see Supplementary material online, Table S6 ). **** P < 0.0001, by post hoc Dunnett’s multiple comparisons test. ( E ) The migration distance (d) of a mesenchymal cell was measured as the shortest distance between the nuclei and the explant origin (dotted lines in panel C ). One example is shown in C . For each explant, mesenchymal cells were divided into three groups based on their migration distance (<50 µm, between 50 and 100 µm, >100 µm). The percentage of cells within each group was then calculated. Within each group (based on migration distances of cells), one-way ANOVA was performed to compare different conditions (treated with control, SEMA6D or SEMA6C) (see Supplementary material online , Table S7 ). *** P < 0.001, ** P < 0.01, * P < 0.05, by post hoc Dunnett’s multiple comparisons test. In panels D and E , data were averaged from 7 to 9 independent cultures for each condition with error bars indicating SEM. The bars in B and C represent 100 µm.

