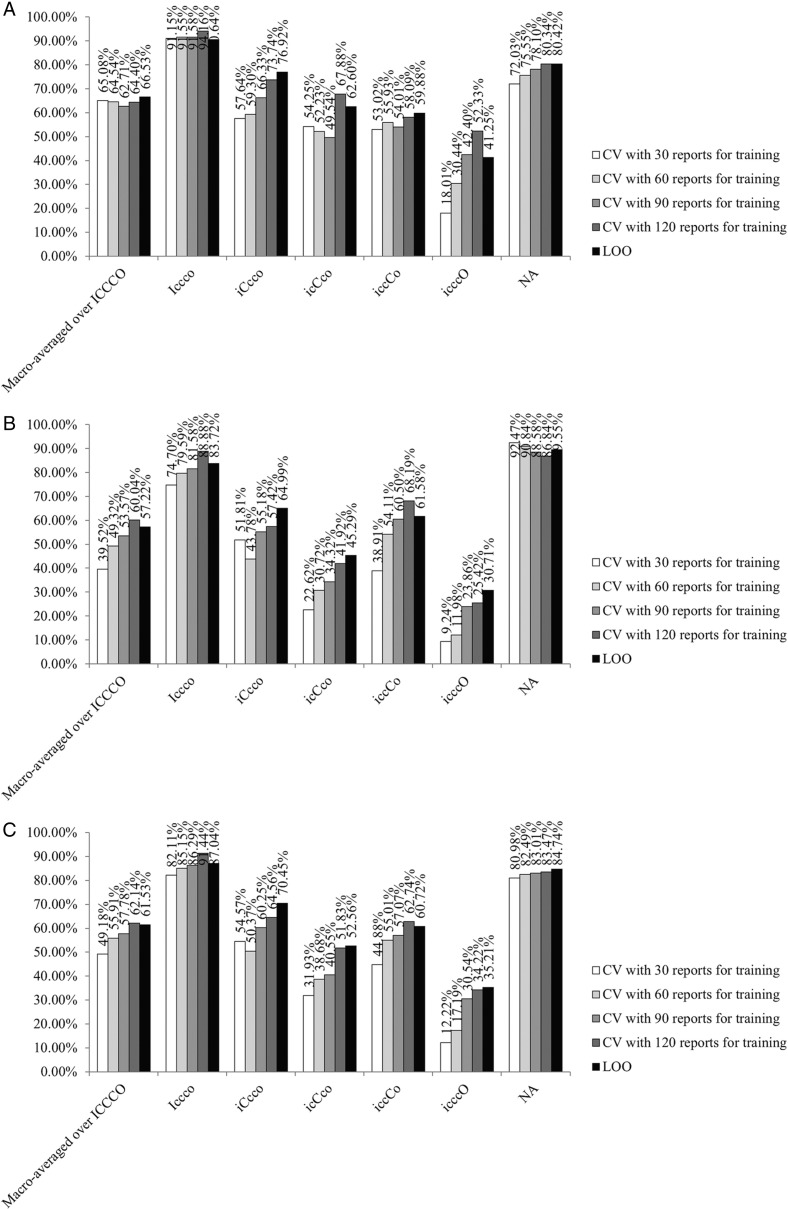
Figure 4:
Precision (4a), recall (4b), and F1 (4c) percentages and learning curves for different cross-validation (CV) settings (ie, training set sizes of 30, 60, 90, 120, and 149 (ie, leave-one-out [LOO] CV) reports with mutually exclusive folds that in combination cover all data). NA refers to the category for irrelevant text. The horizontal direction of the histograms reflects the contribution of having more data for training and the vertical direction the effects of the coupled measured of precision and recall in F1 (see the glossary in online supplementary appendix).

