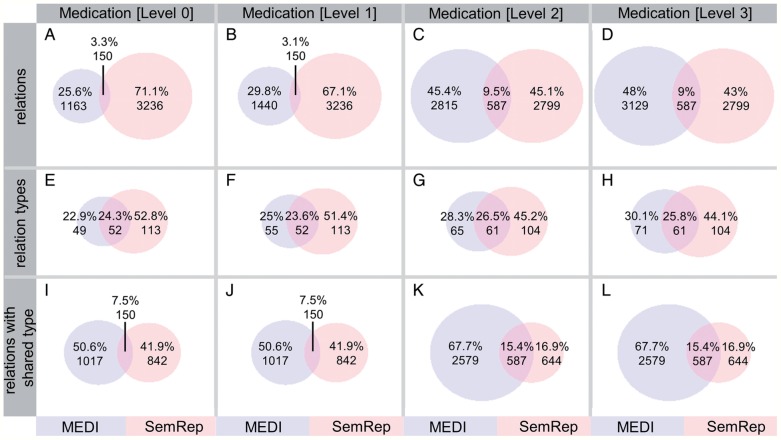
Figure 3:
The diagrams in panels A–D show the connection between the relations identified by the MEDI algorithm and SemRep for each medication expansion level. The diagrams in panels E–H depict the connection between the relation types generated by the two resources. Finally, the diagrams in panels I–L consider the set of relations with their type generated by both resources. MEDI algorithm configuration: MEDI-ALL and the core indication expansion.

