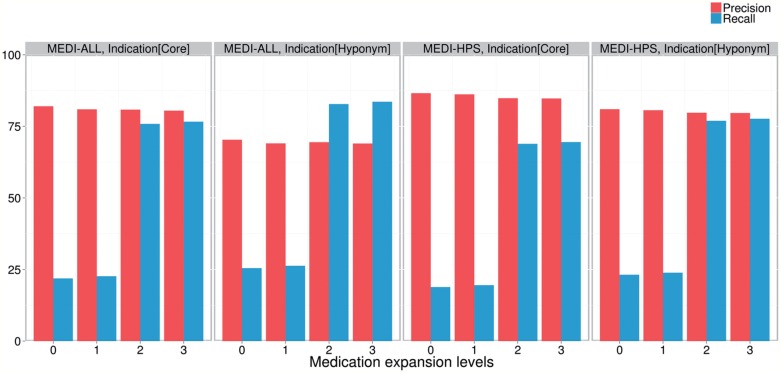
Figure 4:
Precision and recall results achieved by the MEDI algorithm for each expansion configuration. The elements of the horizontal axis in each plot correspond to results for each medication expansion level. The results of the algorithm using MEDI-ALL and MEDI-HPS are shown in the first and last two plots from the left, respectively. The results for the core indication expansion are shown in the first and third plot from the left. Finally, the results for the hyponym indication expansion are shown in the second and fourth plot from the left.

