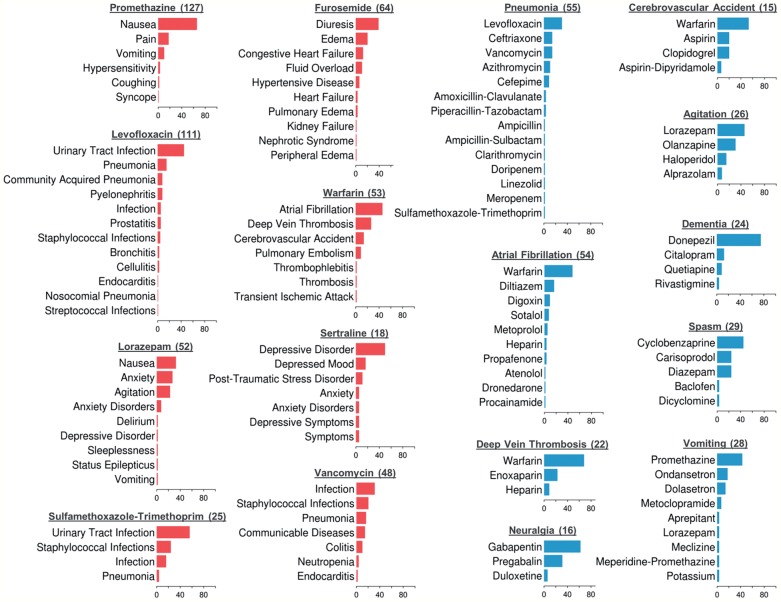
Figure 5:
Percentage distributions of medications and indications computed by running the MEDI algorithm over the set of discharge summaries. Each bar plot in red represents the distribution of all indications treated by a specific medication. Similarly, each bar plot in blue shows the distribution of all medications prescribed for a specific indication. In addition to the concept name, each plot title specifies the number of times the corresponding concept was identified in the dataset. For building these distributions, we converted all medication brand names into their corresponding generic names. MEDI algorithm configuration: MEDI-HPS, the Level 3 medication expansion, and the core indication expansion.

