Figure 1.
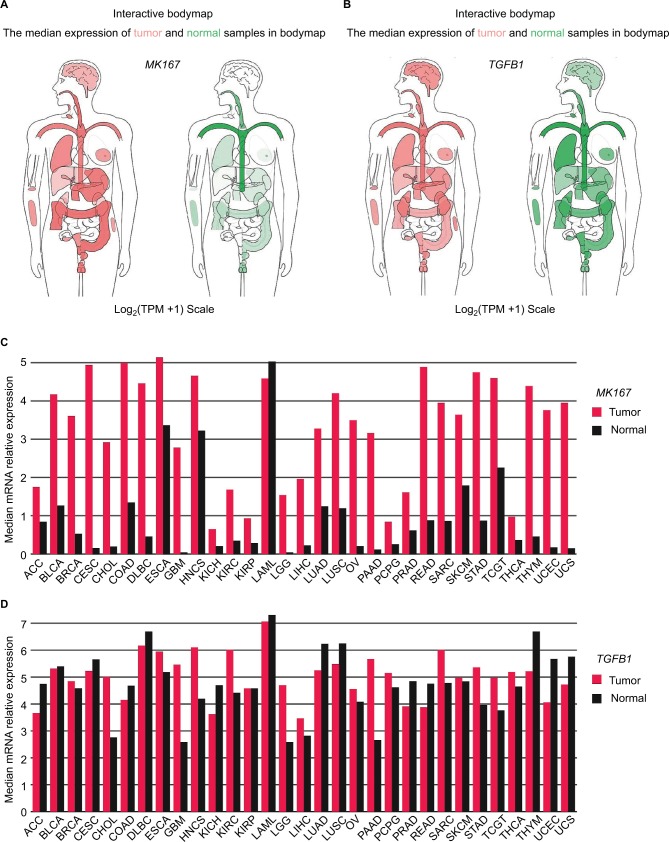
MKI67 and TGFB1 mRNA expression levels distributed in bodymap and chromosomes and differences in cancer tissues.
Notes: (A, B) The median expression of MKI67 and TGFB1 distributed in tumors (red) and normal tissues (green) in bodymap. (C, D) The gene expression profile across all tumor samples and paired normal tissues. The height of the bar represents the median expression of tumors (red) or normal tissues (black).
Abbreviations: LIHC, liver hepatocellular carcinoma; TPM, transcripts per kilobase million.

