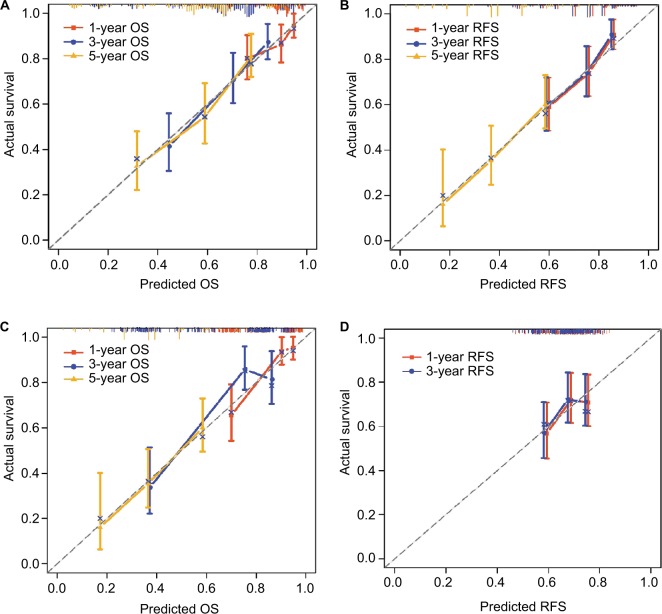
Figure 6.
Calibration curves for predicting patient survival at each time point in the (A, B) Zhongshan and (C, D) Guangxi cohorts.
Notes: Nomogram-predicted OS and RFS are plotted on the x-axis; actual OS and RFS are plotted on the y-axis. A plot along the 45° line would indicate a perfect calibration model in which the predicted probabilities are identical to the actual outcomes.
Abbreviations: OS, overall survival; RFS, recurrence-free survival.

