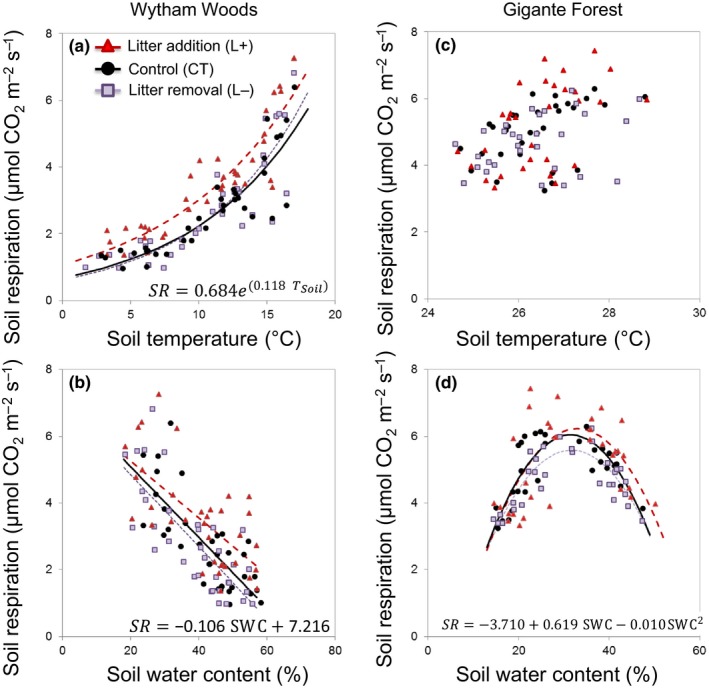
Figure 2.

Relationship between soil respiration and soil temperature or soil water content in litter manipulation plots in (a and b) a temperate deciduous woodland in the UK (Wytham Woods) and (c and d) lowland tropical forest, in Panama (Gigante) from December 2013 to November 2016; each point represents the mean of four measurements per plot for n = 5 plots per treatment. Equations and their parameters are shown for the CT plots
