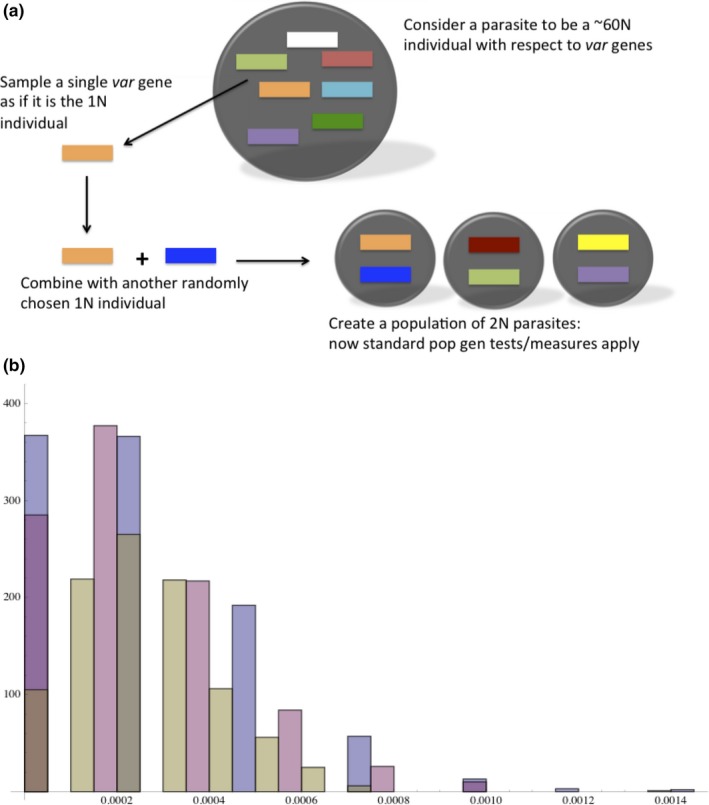
Figure 5.

(a) Population genetic statistics for var genes. Because haplotype‐based analysis is not possible for var genes in a high MOI setting, here we imagine all var genes sharing a single locus and then perform F ST and H‐based tests. (b) The expected homozygosity (1 − Hv) distribution within Vea/Gowrie (blue), within Soe (pink), and within the combined population (yellow)
