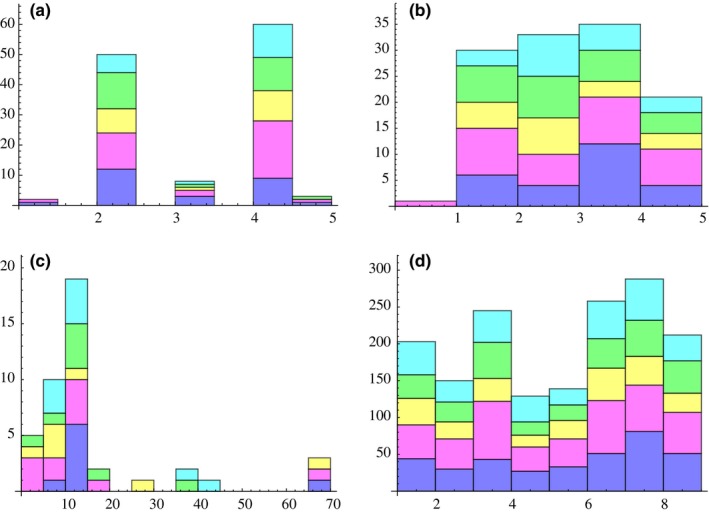
Figure 6.

Potential factors explaining DBLα type modules. Purple = Module 1, Pink = Module 2, Yellow = Module 3, Green = Module 4, Turquoise = Module 5. No association apparent between module membership and the number of cysteines, MOI, sampling location or host age. (a) Number of cysteine residues within the DBLα tag region for a given type, and types grouped by module. (b) Average MSP2‐estimated MOI for a given type, and types grouped by module. (c) Host age for a given type, and types grouped by module. (d) Sampling location(s) for a given type and types grouped by module. Vea Gonga = 1; Vea Nayire = 2; Gowrie Nayire ‐ Kura = 3; Gowrie Tingre = 4; Soe Boko Mission Area = 5; Soe Boko Tamoliga = 6; Soe Sanabisi Tindingo = 7; Soe Sanabisi Akulgoo = 8
