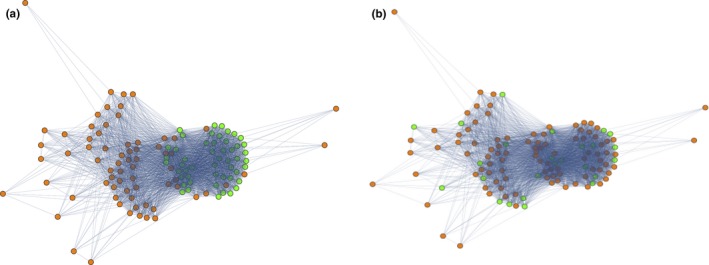
Figure 7.

(a) The HB sharing network of DBLα types, for HBs with less than 50% frequency. The clustering of Cys2 var genes, shown in green (remaining nodes in orange), demonstrate that the HB sharing network is descriptive of var recombination constraints. (b) The var linkage modules cannot be explained by the structure of the recombination network because the var linkage modules do not cluster on the recombination network. Module 1 var genes are shown in green (remaining nodes in orange); the other modules also do not cluster (data not shown).
