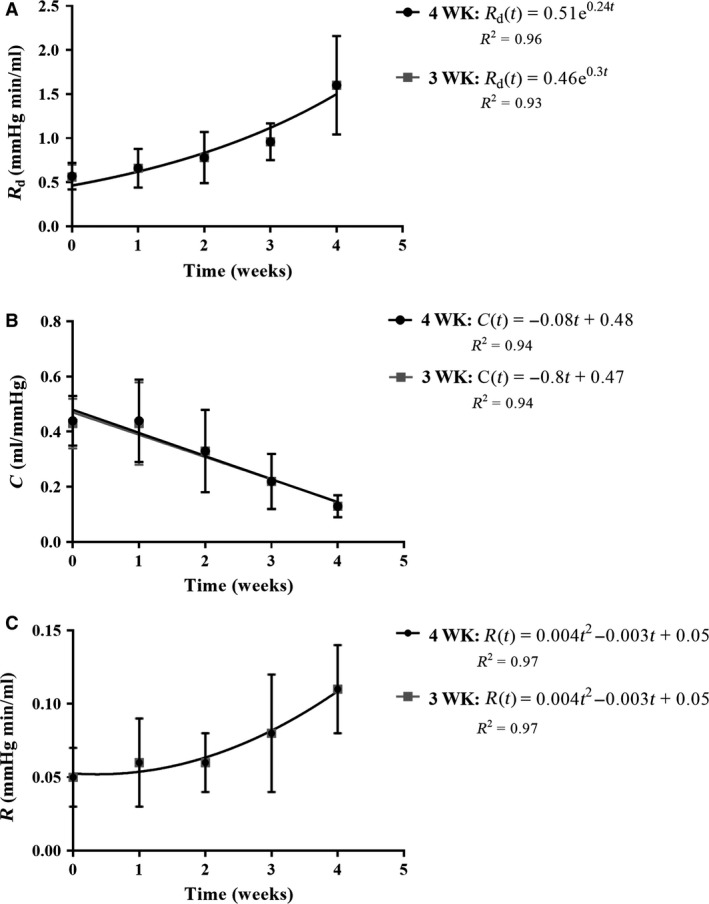
Figure 5.

Summary statistics of the parameters estimated via the three‐ (light grey) and four‐element (black) Windkessel model for each treatment group (week 0 corresponds to the placebo group and week 4 the advanced PAH group). Trend‐lines (light grey and black lines) for both models indicate how (A) distal resistance (R d) increases exponentially while (B) compliance (C) linearly decreases as PAH progresses. (C) Proximal resistance (R) increases nonlinearly but at a slower rate. Coefficient of determination R 2 is included for each model.
