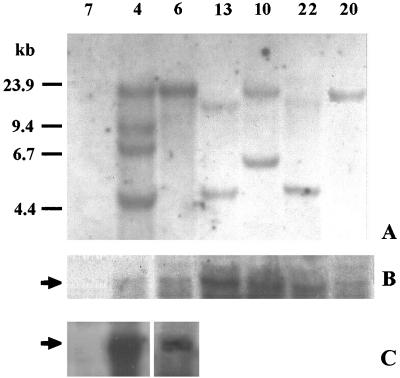
Figure 2.
Southern (A) and northern (B) analysis of the HAL1 gene in six PCR(+) and one PCR(−) tomato plants regenerated after transformation. PCR(+) plants: TG1-4, TG1-6, TG1-13, TG1-10, TG1-22, and TG1-20. PCR(−) plant: TG1-7. In the gel blot, some smearing due to truncated or degraded messages is apparent below the major band at about 1 kb. The arrow on the left marks the position of the HAL1 mRNA. C, Northern analysis of TG2-6 and TG3-4 plants to confirm expression in progeny of primary transformants 4 and 6 used for the physiological experiments.

