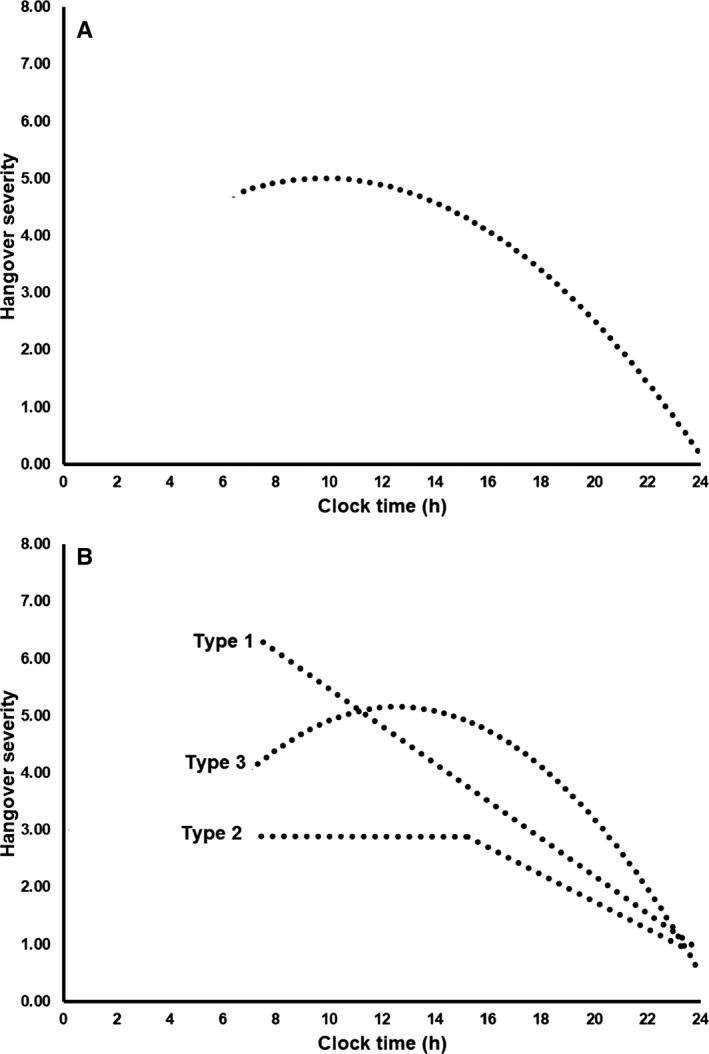
Figure 2.

Variability in hangover severity during the day. Best fitting lines are shown. Panel A shows the overall average hangover severity score for all 727 drinkers. Panel B gives a graphical representation of the 3 most common hangover severity patterns over time. Lines represent Severity Type 1 hangover “continuous decline”; Severity Type 2 hangover “steady state hangover”; and (3) Severity Type 3 hangover “inverted U‐shaped curve hangover.”
