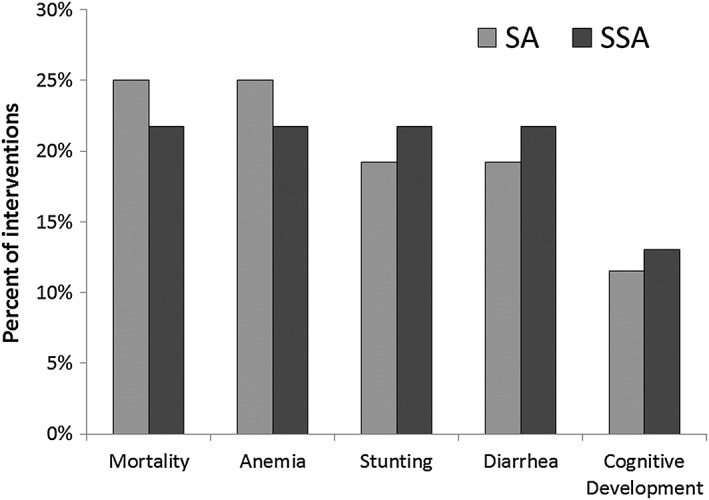
Figure 2.

Percentage of priority programmes targeting each disease outcome. Data shown are out of 48 interventions developed by participants at workshops in South Asia (SA) and Sub‐Saharan Africa (SSA). Because some programmes targeted multiple disease outcomes, values may not sum to 100%
