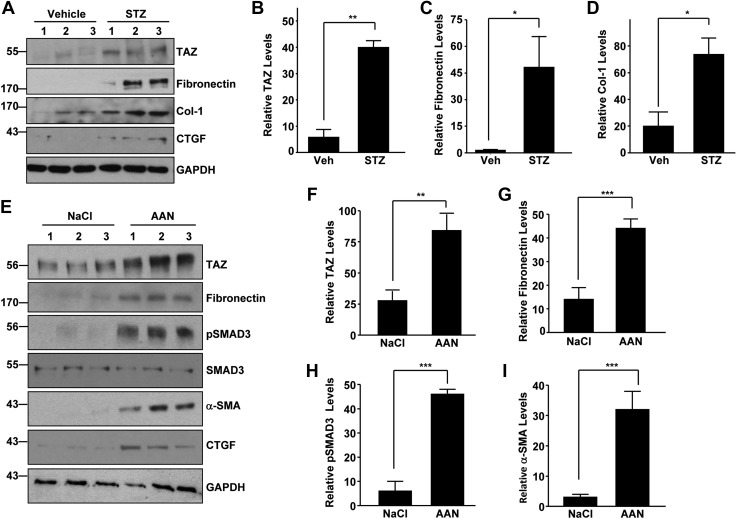
Figure 2.
TAZ deregulation and overexpression in diabetic nephropathy and AAN. A–D) Immune blot analysis of kidney lysates derived from Na citrate vehicle- (Veh) and STZ-treated (200 mg/kg for 26 wk) mice for TAZ (A, B), fibronectin (A, C), collagen-1 (A, D), CTGF, and GAPDH expression. B–D) Relative levels of the indicated proteins between Na citrate (Veh) or diabetic (STZ) kidneys (n = 3–4). A, E) Lanes 1–3: individual mice for each experimental group. E–I) Western blot evaluations of the relative TAZ (E, F), fibronectin (E, G), pSMAD3 (E, H), α-SMA (E, I) and CTGF protein levels between NaCl vehicle- or AA-treated (5 mg/kg; 25 d) kidneys. F–I) Relative expression of indicated markers between NaCl (Veh) or AAN kidneys (n = 3–5 animals/group). Data in all histograms are expressed as means ± sd. *P < 0.05, **P < 0.01, ***P < 0.001, vs. vehicle treated kidneys.

