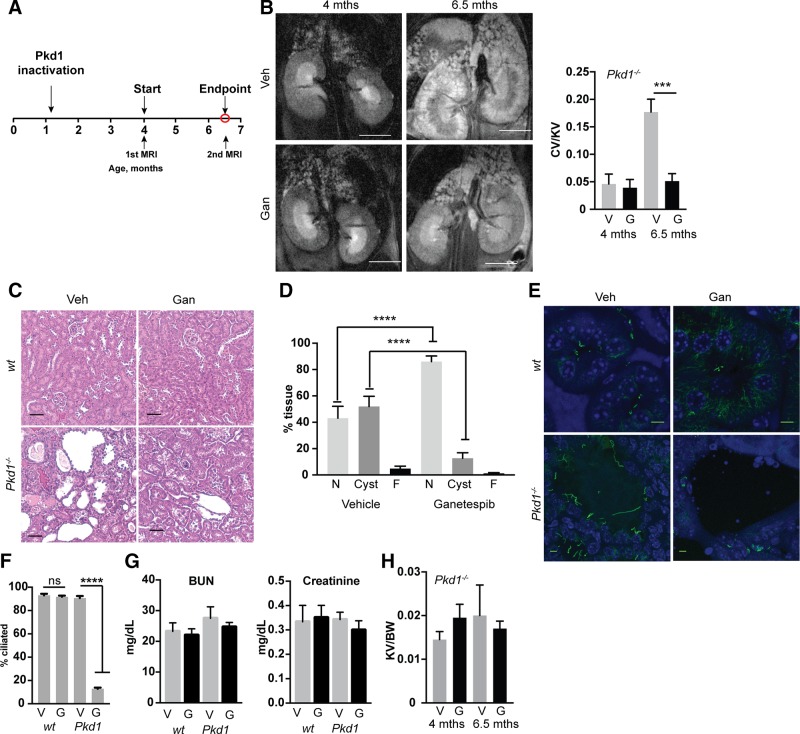
Figure 3.
Ganetespib limits growth and in vivo ciliation in established Pkd1−/− cysts. A) Experimental outline. N = 5 for vehicle (veh)- and ganetespib (gan)-treated WT; 13 for Pkd1−/− with vehicle; and 14 for Pkd1−/− with ganetespib. B) Left, representative MRI images for indicated treatment groups of Pkd1−/− mice at 4 and 6.5 mo of age. Right, quantification of cyst volume as percentage kidney volume (CV/KV) for each group. V, vehicle; G, ganetespib. Scale bars, 500 μm. C) Representative H&E-stained kidney of vehicle- or ganetespib-treated Pkd1−/− mice. Scale bars, 50 μm. D) Cystic index quantified from H&E images in Fig. 1C. N, normal renal tissue; C, cystic; F, fibrotic. E, F) Representative images (E) and quantification (F) of cilia in kidneys of Pkd1−/− and WT mice treated with vehicle or ganetespib for 10 wk. Cilia are visualized with antibody to acetylated α-tubulin (green), with DAPI (blue) indicating nuclei. Scale bars, 5 μm; original magnification, ×240. G) Serum levels of BUN and creatinine in Pkd1−/− and WT mice treated with vehicle (V) or ganetespib (G). N = 6 for WT mice and n = 13 for Pkd1−/− mice. H). Kidney volume (cm³) to body weight (KV/BW) calculated from analysis of MRI images. Data are expressed as means ± sem. *P ≤ 0.05, ***P ≤ 0.001, ****P = 0.0001.

