Figure 6.
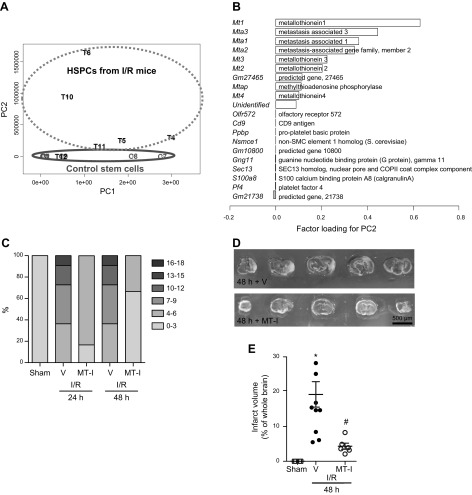
PCA of RNA sequencing transcriptome data from stem cells before (controls; samples C1-3, C7-9) and 24 h after (treated; samples T4-6, T10-12) transfer. A) PCA of 12-transcriptome data showed overall gene expression patterns. On the basis of PC2 values, PCA separated most samples between control vs. treated groups, with exception of sample T12. B) Factor loading for PC2 ranked genes that contributed to PC2 values positively (top half; Mt1, most significant) and negatively (bottom half). C–E) Male C57BL/6 mice underwent 30 min MCAo followed by reperfusion. Mice were treated with MT-1 or PBS (vehicle) 24 h after MCAo and neurological score (C) and infarct volume (D, E) were quantified.

