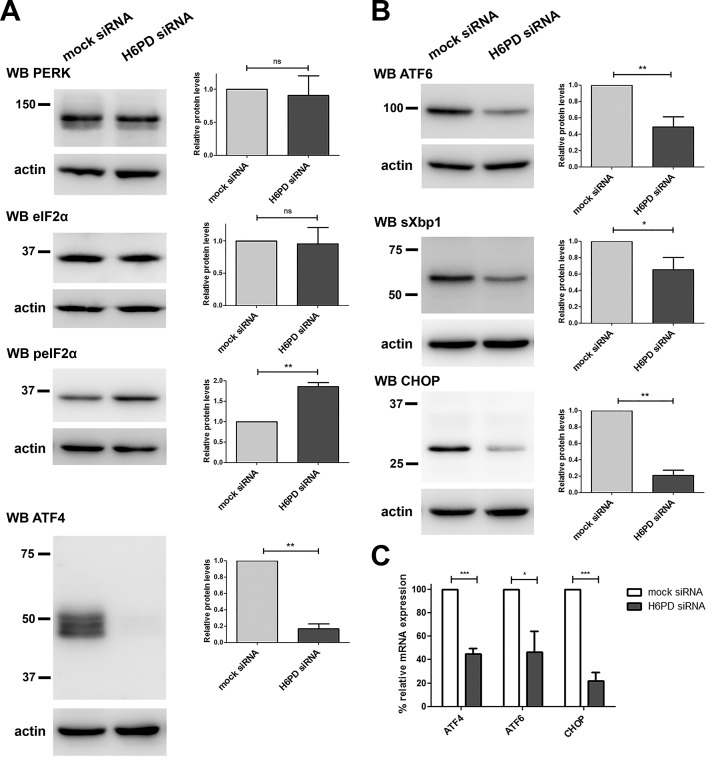
Figure 3.
Alterations in UPR signaling after H6PD silencing. SUM159 cells were mock or H6PD siRNA transfected. A, B) Western blot analysis was performed at 72 h after transfection for semiquantitative analysis of protein levels of PERK, eIF2α, peIF2α, and ATF4 (A) and ATF6, sXBP1, and CHOP (B). A representative Western blot image is shown (left) in addition to the relative protein levels measured from 3 independent experiments by densitometric analysis of the bands after normalization to actin loading control levels (right). C) mRNA expression of ATF4, ATF6, and CHOP 72 h after H6PD down-regulation compared to mock-transfected cells, as assessed through qPCR. Values were normalized to the levels of the gene prolyl cis-trans isomerase A. Ns, nonsignificant. *P < 0.05, **P < 0.01, ***P < 0.001 vs. mock siRNA.

