Figure 5.
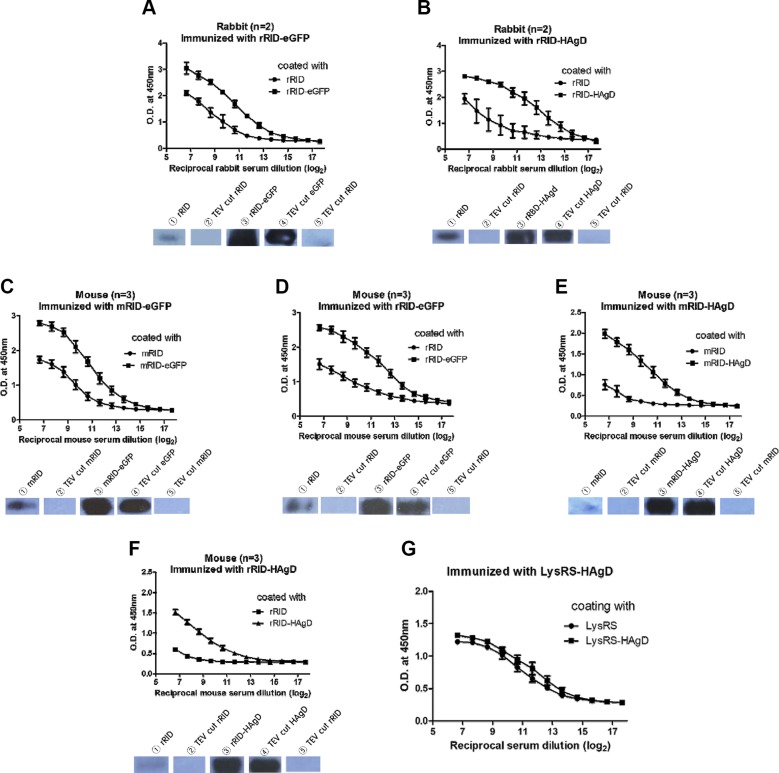
Analysis of differences in antibody production levels by an ELISA and WB. A) The difference in antibody levels (according to an ELISA) between groups rRID and rRID-eGFP relative to the serum samples from rabbits (n = 2) immunized with rRID-eGFP; (lower) WB analysis for the detection of antibodies in the rabbit serum samples. B) Differences in antibody levels between groups rRID and rRID-HAgD relative to the serum samples from rabbits (n = 2) immunized with rRID-HAgD; (lower) WB analysis for the detection of antibodies in the rabbit serum samples. C–F) Differences in antibody levels between groups RID and RID-fused protein relative to the serum samples from mice (n = 3) immunized with an RID-fused immunogen; (lower) WB analysis for the detection of antibodies in the mouse serum samples. G) Differences in antibody levels between groups eLysRS and eLysRS-HAgD relative to the serum samples from mice (n = 5) immunized with eLysRS-HAgD. Error bars indicate the sd of each cohort. The x-axis indicates reciprocal serum dilution (log2). The initial serum dilution value was 1/200 and 1/3200 for mice and rabbits, respectively.

