
Figure 7.
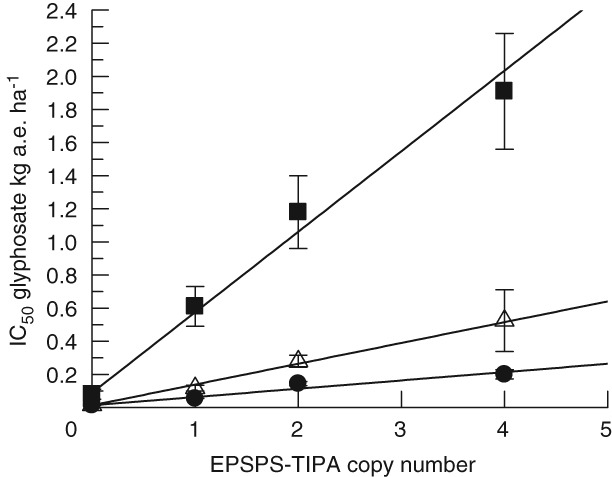
IC50 values (Table 2) for glyphosate vs. TIPA gene copy number are plotted for correlation. Reproductive stage treatment with fresh weights for the foliar portion of the plant broken out into leaves ( ), with linear fit, m = 0.487, r
2 = 0.996, chi2 = 0.023 and inflorescence (
), with linear fit, m = 0.487, r
2 = 0.996, chi2 = 0.023 and inflorescence ( ), with linear fit, m = 0.257, r
2 = 0.995, chi2 = 0.014. The vegetative stage treatment for seed production (
), with linear fit, m = 0.257, r
2 = 0.995, chi2 = 0.014. The vegetative stage treatment for seed production ( ), with linear fit, m = 0.050, r
2 = 0.983, chi2 = 0.009. Error bars are ± standard error (SE) of the mean.
), with linear fit, m = 0.050, r
2 = 0.983, chi2 = 0.009. Error bars are ± standard error (SE) of the mean.