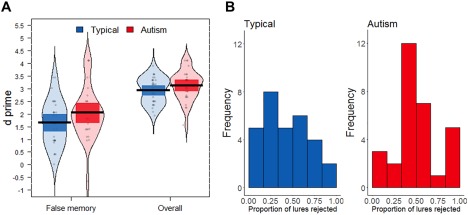
Figure 3.

False memory performance for typically developing and autistic children. (A) D prime for discriminating previously presented items from critical lures (“false memory”) and for discriminating previously presented items from all non‐presented items (“overall”). Shown are the group mean (black line), 95% confidence intervals (dark colored bands), individual data points and smoothed density. (B) Histograms for the proportion of critical lures correctly rejected for each group.
