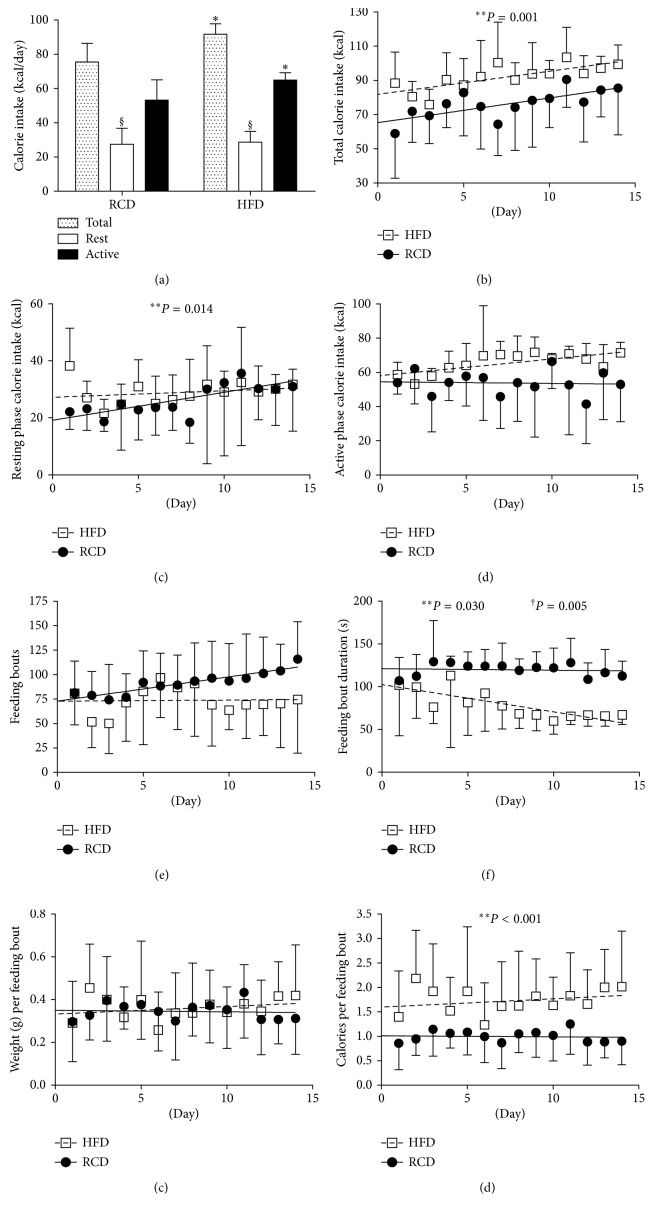
Figure 2.
Total (a-b), resting phase (c), and active phase (d) calorie intake; number of daily feeding bouts (e), average feeding bout duration (f), and weight (g) as well as calories per feeding bout (h) in young rats submitted to HFD or RCD for 14 days. Results are presented as means ± SD; ∗ indicates significant difference between the two groups (P < 0.05) and § indicates significant difference from nocturnal value at the P < 0.05 level using an unpaired Student's t-test; ∗∗ indicates significant difference between the two groups (P < 0.05) and † indicates a significant group × time effect (P < 0.05) using a mixed linear regression test.

