Figure 2.

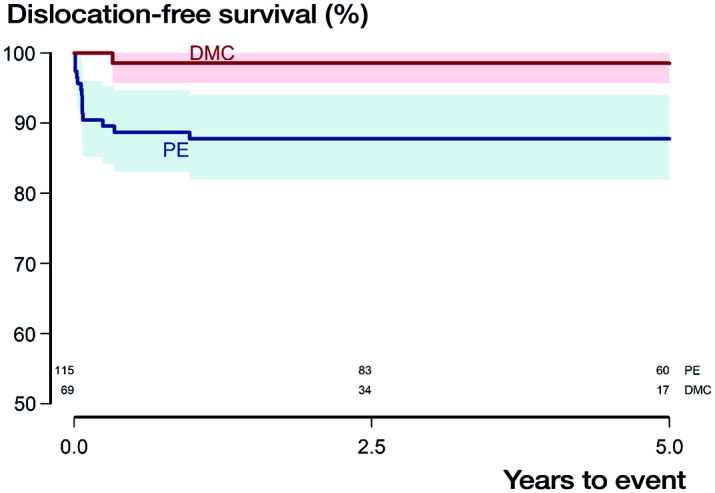
Kaplan–Meier survival curves with the endpoint dislocation with shaded area indicating CI (p = 0.01, derived from Mantel–Haenszel log-rank test). Numbers at risk for both subgroups are given above the X-axis.

Kaplan–Meier survival curves with the endpoint dislocation with shaded area indicating CI (p = 0.01, derived from Mantel–Haenszel log-rank test). Numbers at risk for both subgroups are given above the X-axis.