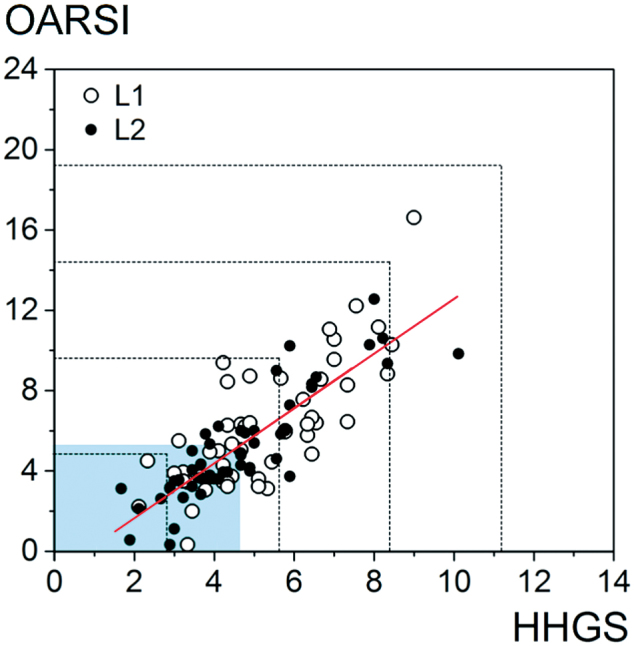
Figure 2.

Correlation plot of average HHGS versus average OARSI scores for specimens from lateral and medial locations. Moderate correlation was observed between the 2 systems (Spearman’s coefficient =0.806). The total HHGS and OARSI scores were divided into 5 equal bins as indicated by the dotted lines, and classified as early, mild, moderate, and severe to assess specimen distribution. The shaded regions on the bottom and left represent the regions containing the 50% of samples with scores below the median for each scoring system (median HHGS =4.8, OARSI =5.5) where correlation between the systems is less robust. For illustration, the trend is represented by a red line from a fitted linear regression of OARSI on HHGS.
