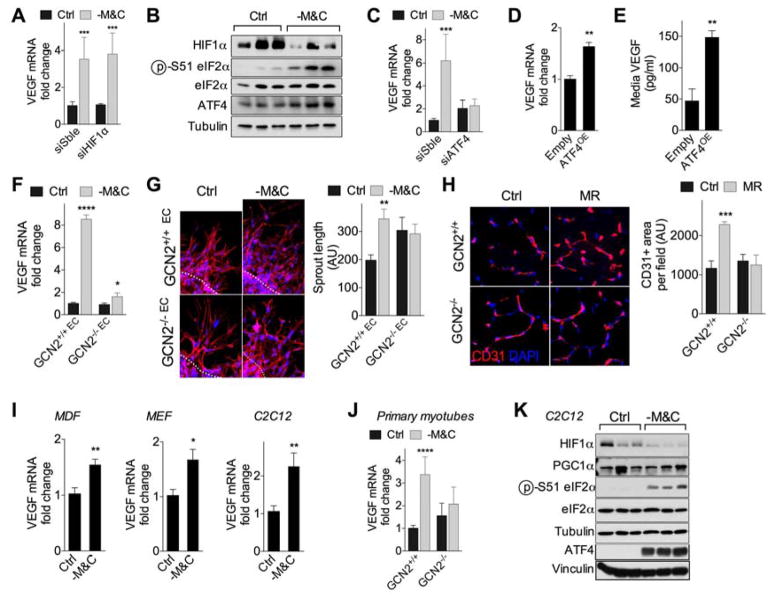
Figure 2. GCN2-dependent, hypoxia-independent regulation of VEGF and angiogenesis upon SAA restriction.
(A) Relative VEGF mRNA expression in HUVEC 2d after transfection with HIF1α siRNA or control scrambled (Sble) siRNA and cultured in control (Ctrl) or SAA deficient (-M&C) media for 16hr; n=5 experiments/group; error bars indicate SEM. (B) Immunoblots of HIF1α, eIF2α (p- Ser51, total) and ATF4 in HUVEC cultured as indicated for 16hr. (C) Relative VEGF mRNA expression in HUVEC 2d after transfection with ATF4 or Sble siRNA and cultured as indicated for 16hr; n=4 experiments/group; SEM. (D, E) Relative HUVEC VEGF mRNA expression (D, n=3 experiments/group; SEM) and secreted VEGF protein concentration in media (E, n=3–6 experiments/group; SEM) 2d after transfection with ATF4 overexpression (ATF4OE) or control construct (Empty). (F, G) VEGF mRNA expression (F) and spheroid formation (G) in WT and GCN2KO primary mouse EC from n=3 mice/genotype cultured as indicated for 16hr. For sprouting assay (G), representative images (left, 40X mag) and quantification (right) of WT and GCN2KO EC spheroids cultured in the indicated media for 24hr; blue, DNA (DAPI); red, F-actin (phalloidin). (H) Representative transverse sections (left, 40X mag) and quantification (right) of CD31-stained gastroc in WT or GCN2KO mice fed for 2–4wk on Ctrl or MR diets; n=5–6 mice/group. (I) VEGF mRNA in MDF, MEF or C2C12 myotubes cultured as indicated for 16hr; n=4–6 experiments/group; SEM. (J) VEGF mRNA expression in WT and GCN2KO primary mouse skeletal myotubes (n=5 mice/genotype tested at 2 different passages) cultured as indicated for 16hr. (K) Immunoblots of HIF1α, PGC1α, eIF2α (p-Ser51, total) and ATF4 in C2C12 myotubes cultured as indicated for 16hr. Error bars indicate SD unless otherwise noted; asterisks indicate the significance of the difference by Student’s T test or 1-way ANOVA with Sidak’s MCT between diets in vivo or SAA deprivation in vitro; *P<0.05, **P<0.01, ***P<0.001. See also Fig. S2.

