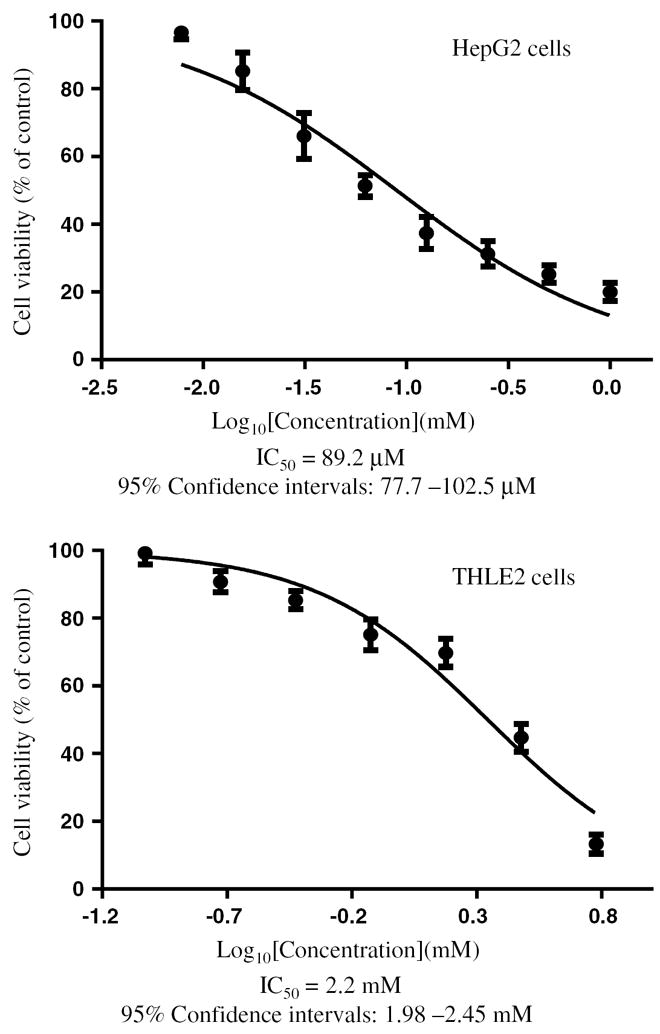
Fig. 1.

The half inhibitory concentration (IC50) of AZT. HepG2 cells and THLE2 cells were exposed to various concentrations of AZT (0–1 mM for HepG2 cells; 0–6 mM for THLE2 cells) for 1 week. After the treatment, the total number of viable cells was determined by an MTT assay. The IC50 values were obtained from the cell growth curves using GraphPad Prism 5.0
