
Figure 2. Visualization of the 167-kb heterozygous deletion in case 1 encompassing the MNDA gene on chromosome 1q, exported from the Illumina Genome Viewer.
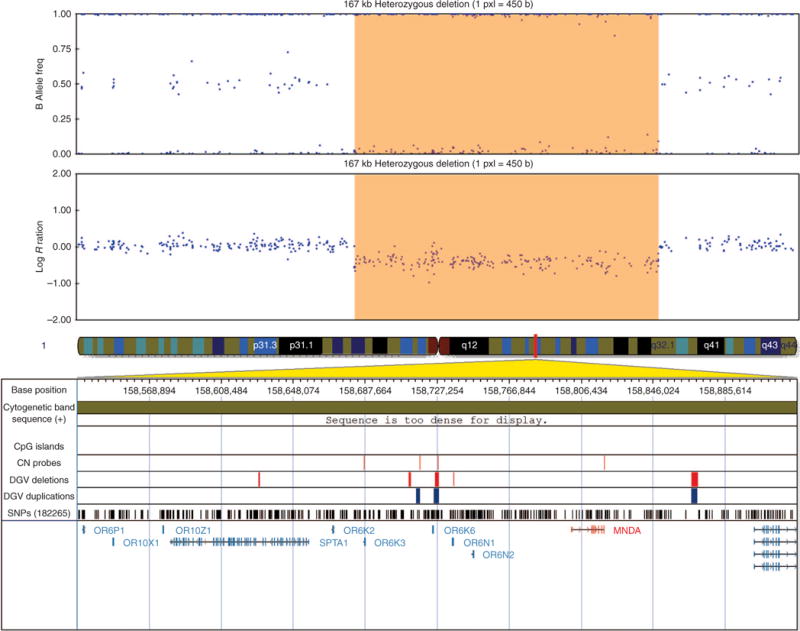
The top panel depicts B-allele frequency (ratio of minor to major alleles), and the bottom panel depicts the log R ratio data (signal intensity). Tracks provided by Illumina show cytobands, CpG islands, and the location of single-nucleotide polymorphisms on the array. Custom tracks were created to display the location targeted by copy-number assays used to validate copy-number variants (CNVs; “CN probes”), and copy-number losses (“DGV deletions,” shown in red) and gains (“DGV duplications,” shown in blue), both of which were downloaded from the DGVa database. Genes/transcripts overlapping or intersecting CNVs and genes immediately flanking the CNVs are listed below the panels. Genes with potential relevance to heterotaxy are highlighted in red. CNV calls made using the PennCNV algorithm are highlighted (heterozygous deletions in orange and duplications in blue). hg19 Coordinates are shown.