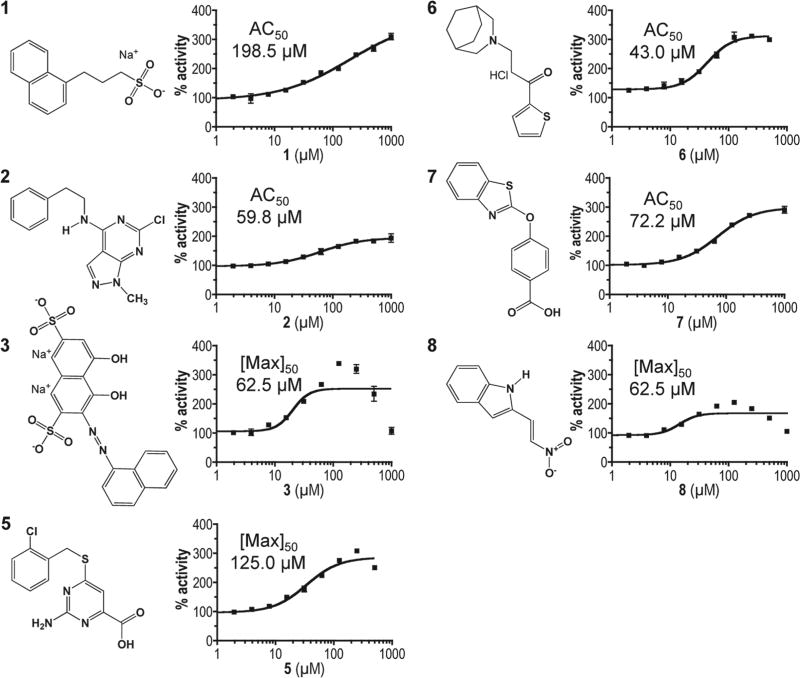
Figure 2.
Chemical structures and dose-response profiles of insulin-degrading enzyme (IDE) activators. Compounds were identified by their ability to enhance rat IDE-mediated in vitro cleavage of the peptide reporter depicted in Figure 1C. Structures were downloaded from the Developmental Therapeutics Program (DTP) structure database (http://dtp.nci.nih.gov/branches/dscb/diversity_explanation.html). Compound 4 was eliminated due to a lack of measurable effect on IDE kinetic parameters and inconsistent behavior across experiments. Compounds were evaluated for their effectiveness at stimulating rat IDE activity over the indicated dose range using the fluorescence-based IDE activity assay described in Figure 1. A best-fit nonlinear dose-response curve was determined for data points using GraphPad Prism 4.0 and a four-parameter logistic equation (solid line). Where sigmoidal dose-response curves were observed, AC50 values were determined. Where hormetic response curves were observed (i.e., 3, 5, 8), the fitted curves could not be used to determine accurate AC50 values, so the lowest half-maximal activating concentration is reported ([Max]50).

