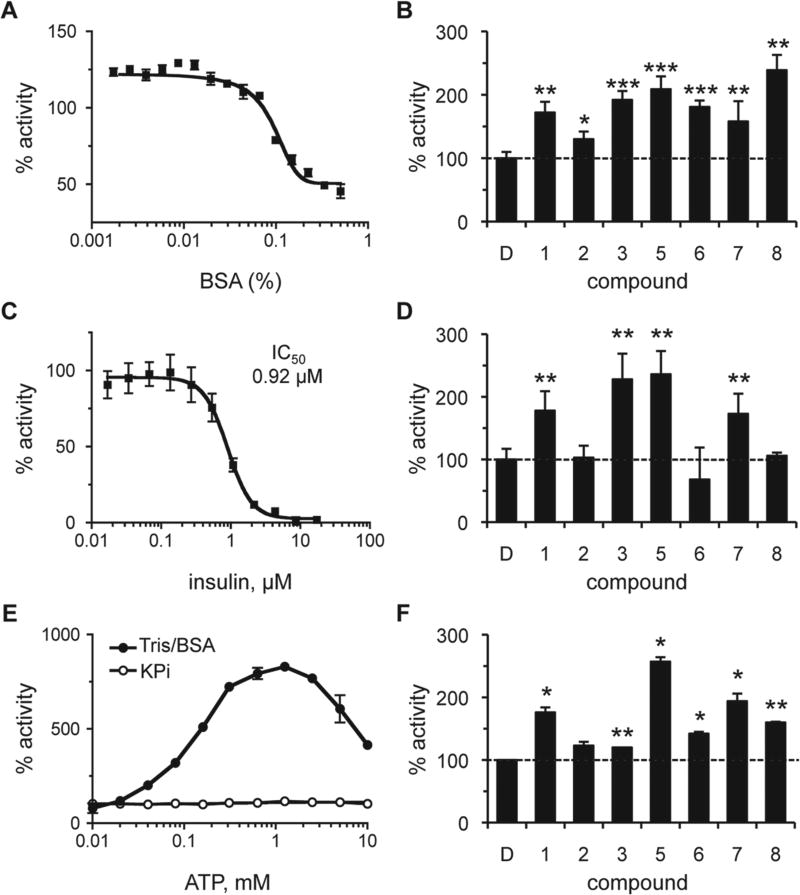
Figure 4.
Effect of assay conditions on the properties of rat insulin-degrading enzyme (IDE) activators. The effect of bovine serum albumin (BSA), insulin, and adenosine triphosphate (ATP) on the activity of IDE was determined both in the absence and presence of compounds. Rat IDE was used (87.7 nM) in the assay described in Figure 1. Values are reported as percentages relative to a water or DMSO-treated control as appropriate (n = 4); *p < 0.05, **p < 0.01, and ***p < 0.001 relative to the mock-treated control. For dose-response curves, data points were plotted, and a best-fit nonlinear dose-response curve was determined using GraphPad Prism 4.0 as described in Figure 2. (A) Observed activity of IDE in 0.1 M KPi over a range of BSA (0%–0.5% final). (B) Observed activity in the presence of compounds (100 µM) in 0.1 M KPi/0.01% BSA. The dashed line is a visual reference for 100% activity (also present in panels D and F). (C) Observed activity of IDE in 0.1 M KPi over a range of human insulin (0–17.2 µM). (D) Observed activity in the presence of compounds (100 µM) in 0.1 M KPi containing 0.92 µM (IC50) insulin. (E) The effect of ATP (0–10 mM) on IDE activity was evaluated in 0.1 M KPi or 50 mM Tris (pH 7.5) containing 0.01% BSA (Tris/BSA). (F) Observed activity of IDE in the presence of compounds in Tris/BSA containing 1 mM ATP. Compounds were used at optimal concentrations as derived from dose-response curves in Tris/BSA buffer (S. P. Manandhar and W. K. Schmidt, unpublished observations). Compound 1 was used at 1000 µM; compounds 5, 6, and 7 at 500 µM; compound 2 at 250 µM; and compounds 3 and 8 at 125 µM.

